
EUR/GBP long-term technical analysis
The world’s focus is on coronavirus and the impact to the economy. In the first quarter, the impact was massive and put most major currencies on the backfoot against safe-haven currencies. EUR/GBP also swinging wildly between 0.8400 – 0.9300. The pair move sharply higher in the March trading month however could not make a higher close above 0.9000.
The second quarters economic data soon will be released. Traders and investors will focus on economic development also the coronavirus situation. EUR/GBP trend could change dramatically depend on the data results.
New Month
Monthly chart


EUR/GBP range span between 0.8400 – 0.9300 with 0.9000 as major level to watch. The pair upward movement always close below the level for three months. This month, we have a bullish attempt which has moved above 0.9000. If the bull could maintain the pressure and close the month above 0.9000 then traders could expect further upside in the coming month.
Weekly chart
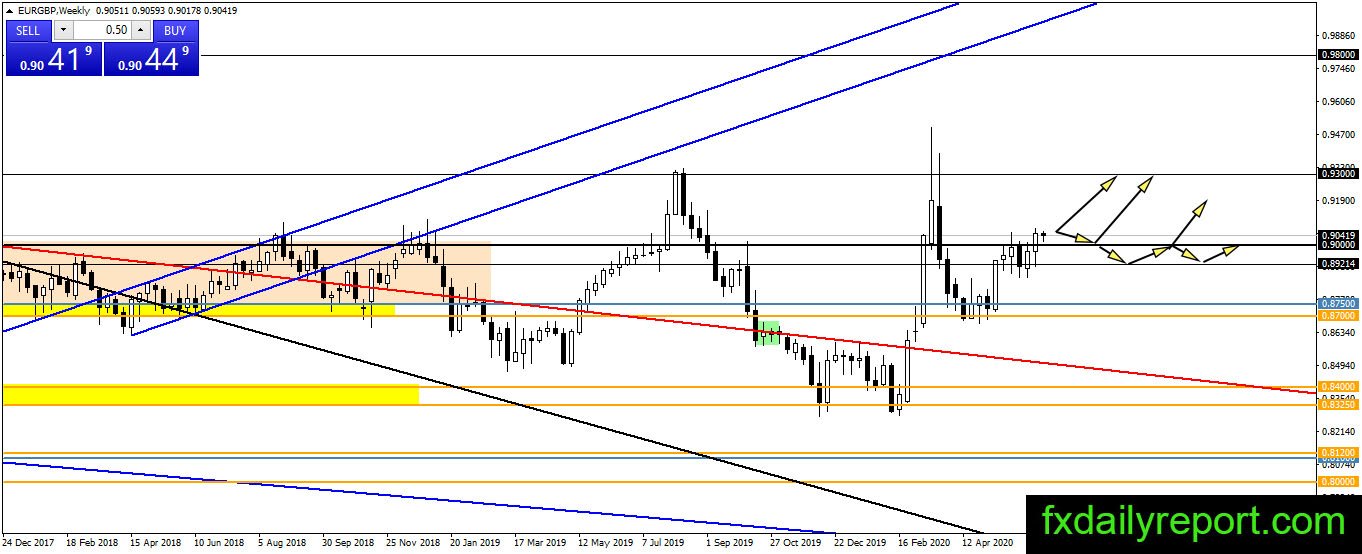
A higher-high printed above 0.9300 in March and there is a higher low formed between April – May. The pair currently moving upward and will attempt to print further higher high above March high. As long as there is no lower low printed on the chart, EUR/GBP set to continue its bullish movement.
Daily chart

EUR/GBP surpassed the 0.9000 resistance level and set to continue its bullish movement inside the bullish channel shown on the daily chart. If the pair move lower to retest 0.9000 or the bottom of channel then traders could enter long positions.
Trade plan
On the long-term view, EUR/GBP currently trades inside the 0.8400 – 0.9300 area and trying to continue its bullish movement. The pair building bullish pressure against 0.9000 and might break out from it. On the daily chart, we could see a bullish channel where trades could look for long positions near the bottom of it.
0.9000 is the level to watch for long positions too. However, traders might want to be careful if there is a lower low below 0.8700 – 0.8750 area.