
EUR/GBP long-term technical analysis
We have mentioned that the pair will reach the 0.8400 support level and it managed to reach it and then form a bullish reaction to target the top of the range at 0.9300. There is no change to the outlook of the pair which ranges between 0.8400 – 0.9300. A meltdown in EUR against the U.S. dollar helped the pair to move lower. However, the current situation where inflation starts to cool and the Fed might shift their interest-rate policies could become a reason for further weakness in EUR/GBP.
New Month
Monthly chart
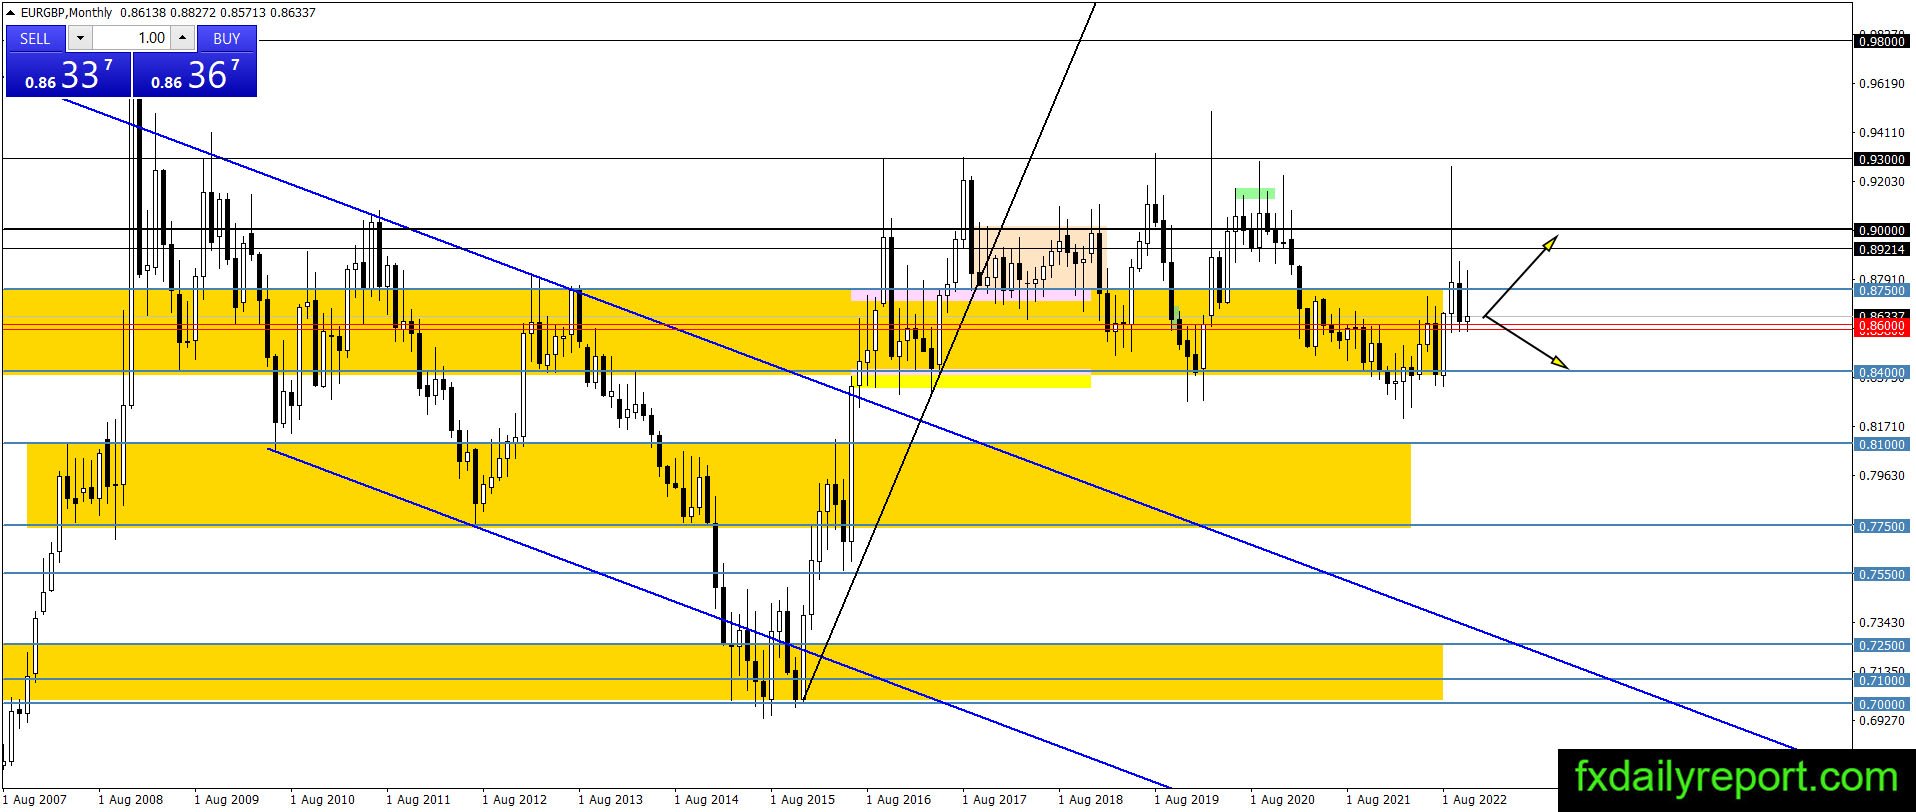
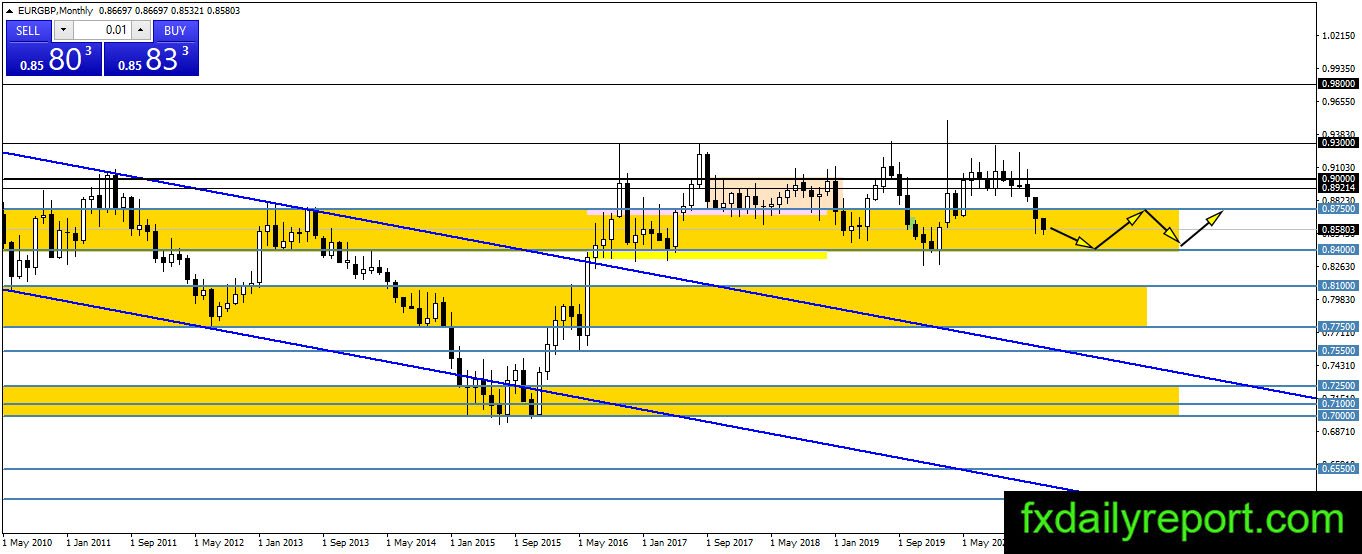
The monthly chart of EUR/GBP has shown that the pair range span between 0.8400 – 0.9300 which mean traders could enter long positions at the bottom of the range and short positions at the top of the range. The pair has reached the top of the range and currently starts moving lower. Traders will wait near the bottom of the range for a chance to enter long positions again.
Weekly chart

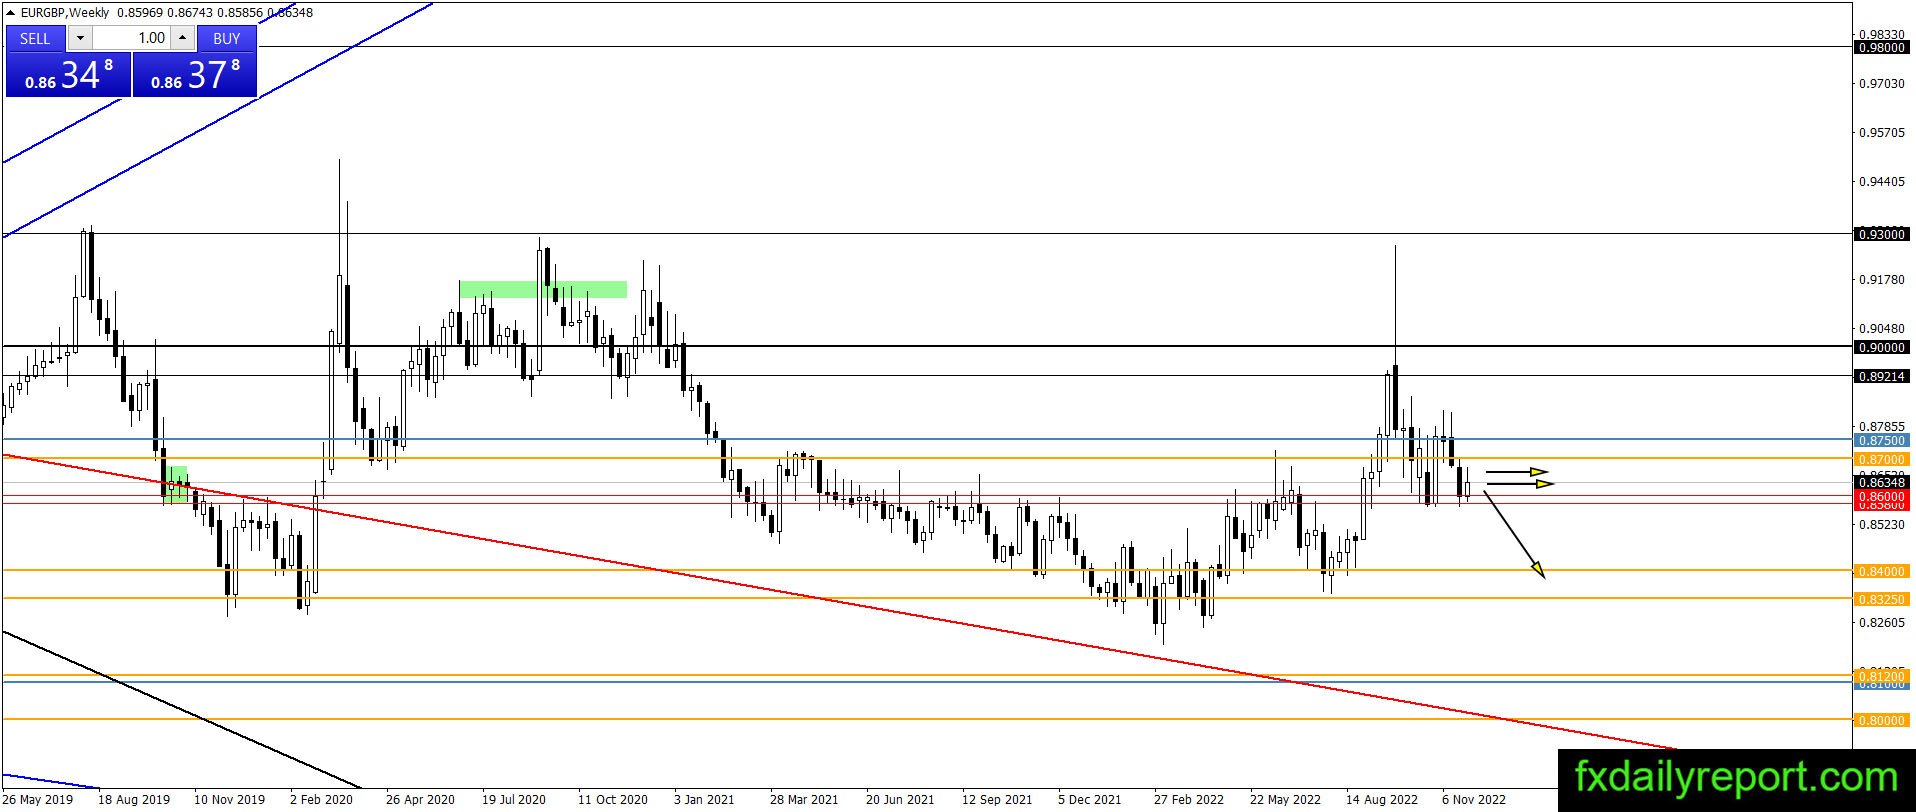
On the weekly chart, EUR/GBP is supported by the 0.8580 – 0.8600 area but we might see a bearish breakout below the area. If a bearish breakout happens then EUR/GBP will follow the higher time-frame outlook to target the 0.8400 support level. Traders will avoid long positions or only enter speculative long positions for now.
Daily chart
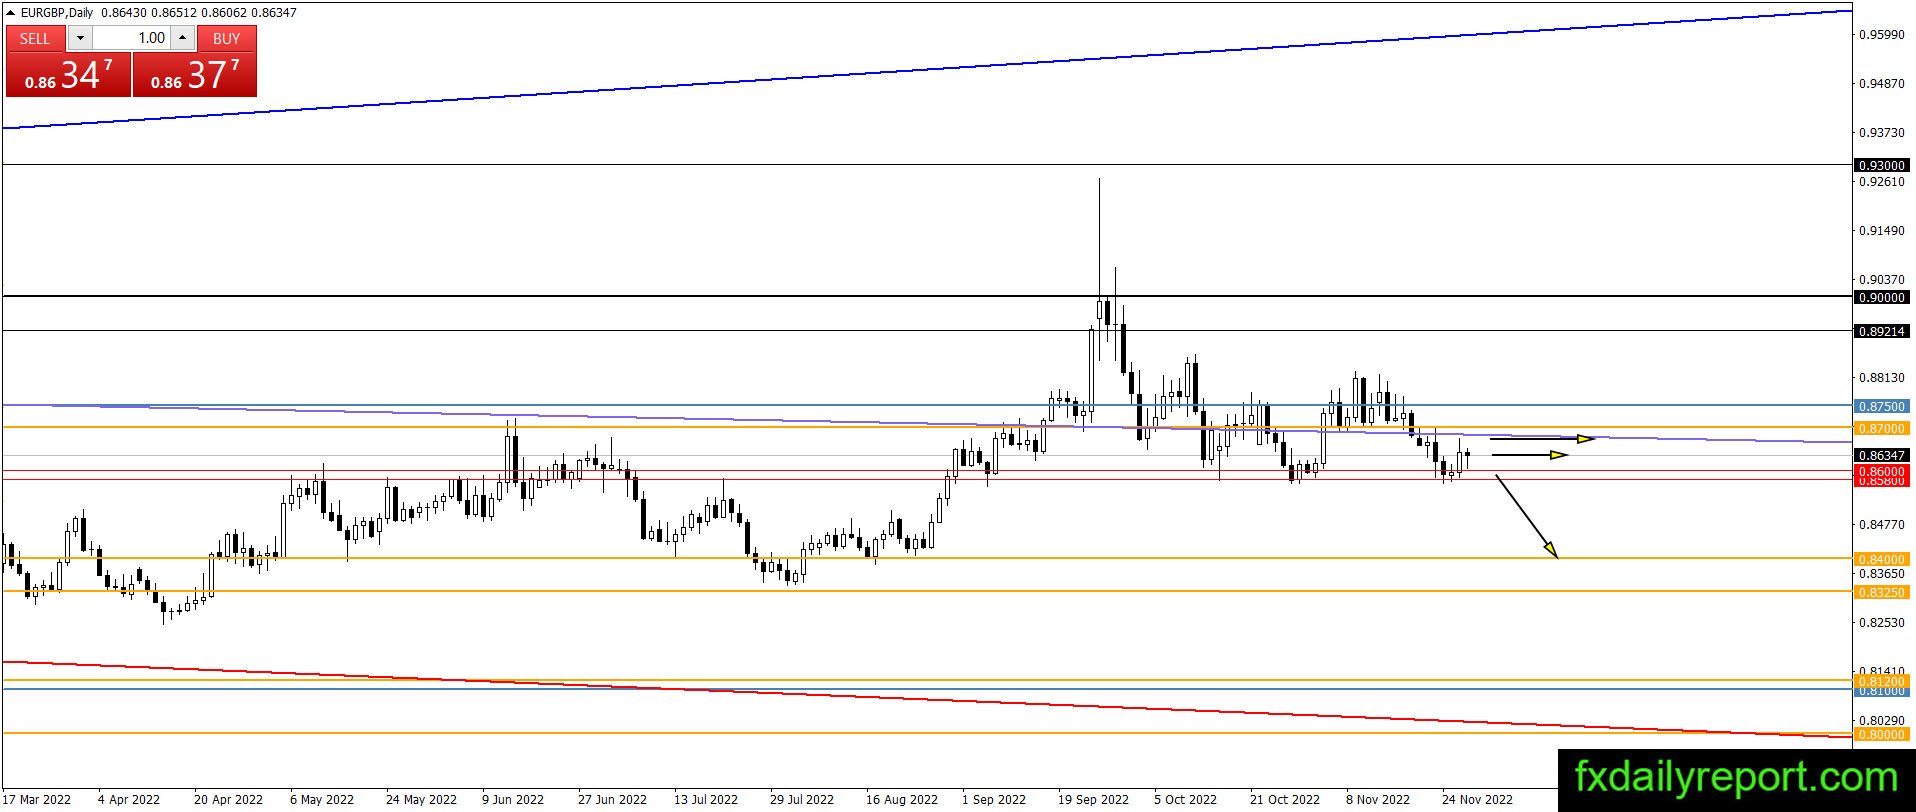
EUR/GBP outlook on the daily chart is similar to the outlook on the weekly chart. The pair is waiting for further reactions from the 0.8580 – 0.8600 support area. If the pair breakout lowers then it will target the 0.8400 support level. On the other hand, if the pair could move upward and print a new higher high then there is a chance of bullish movement to target 0.8900 – 0.9000.
Trade plan
EUR/USD has completed the 0.8400 target and moved upward near the 0.9300 resistance level. At the current time, the pair is trading lower again to target the 0.8400 support level. Traders will continue to use the 0.8400 support level as a place to enter long positions while using the 0.9300 resistance level as a place to enter short positions.