
The EUR/JPY currency pair on Monday extended the current pullback towards 123.408 after hitting a new 13-month high of 124.400 last week. The pair continues to trade within an ascending curve, which indicates a short-term bullish bias in the market sentiment.
The recent pullback has pushed the pair off overbought levels of the 14-hour RSI in the 60-min chart. It is now trading closer to the oversold levels but remains several pips above the 100-hour and the 200-hour SMA lines.
EUR/JPY Fundamentals Overview

From a fundamental perspective, the EUR/JPY currency pair is trading at the back of a relatively busy period in both markets. Monday, Japan’s Gross Domestic Product for Q1 missed the (QoQ) forecast of -0.5% with -0.6%. It also came short of the annualized Q1 estimate of -2.1% with -2.2%. However, bank Lending for May increased by 4.8%, which beat the expectation of 3.2%. On the other hand, the non-seasonally adjusted current account balance for April came short of 480 B Yen with 262.7 B Yen, down from 1,971 B yen, in the previous period.
In Europe, the seasonally adjusted German Industrial Production for April missed the (MoM) expectation of -15.5% with -17.9%. The non-seasonally adjusted working day tuned Industrial Production fell 25.3% in April compared to a decline of 11.3% in the previous month. The EU Sentix Investor Confidence for June also missed the expectation of -22.5 with a reading of -24.8. This was a significant improvement from the previous reading of -41.8.
EUR/JPY Technical Analysis (the 60-min Chart)
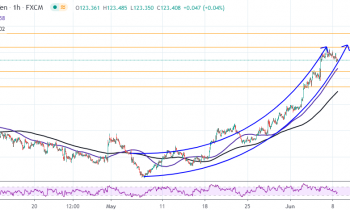
Technically, the EUR/JPY currency pair appears to be trading within an ascending curve. This indicates a short-term bullish bias in the market sentiment. The pair has recently pulled back to move closer to oversold levels of the 14-hour RSI in the 60-min chart.
The bulls will be targeting short-term profits at around 124.400 or higher at 125.458. On the other hand, the bears will be targeting short-term profits at around 122.557 or lower at 121.362.
EUR/JPY Technical Analysis (the Daily Chart)
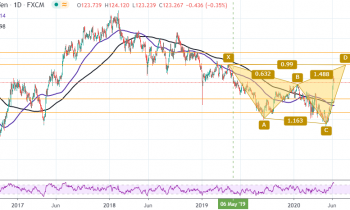
In the daily chart, the EUR/JPY currency pair appears to be on course to complete a XABCD double-bottom reversal pattern. This comes after it bottomed below 115.00 last month. It has since surged to overbought levels of the 14-day RSI, well above the 100-day and the 200-day SMA lines.
The bears will be targeting pullback profits at around 120.037 or lower at 117.337. On the other hand, the bulls will be looking to pounce for long-term profits at around 126.782 or higher at 129.211.