
EUR/JPY long-term technical analysis
EUR/JPY descend consistently since February major bearish engulfing. The pair is on backfoot as major uncertainties hit the market. President Trump imposed tariffs on China and allies invite strong disagreement and retaliation. Tension increased around the world, and safe-haven currencies become top choices for traders and investors.
Japanese Yen is one of the safe-haven currency which will enjoy appreciation. On the other hand, Euro might stay defensive after ECB decided to end massive QE program by December 2018. Expect EUR/JPY continue its stride lower this year.

Click here to see previous month EUR/JPY long-term technical analysis March 2018
New Month
Monthly Chart
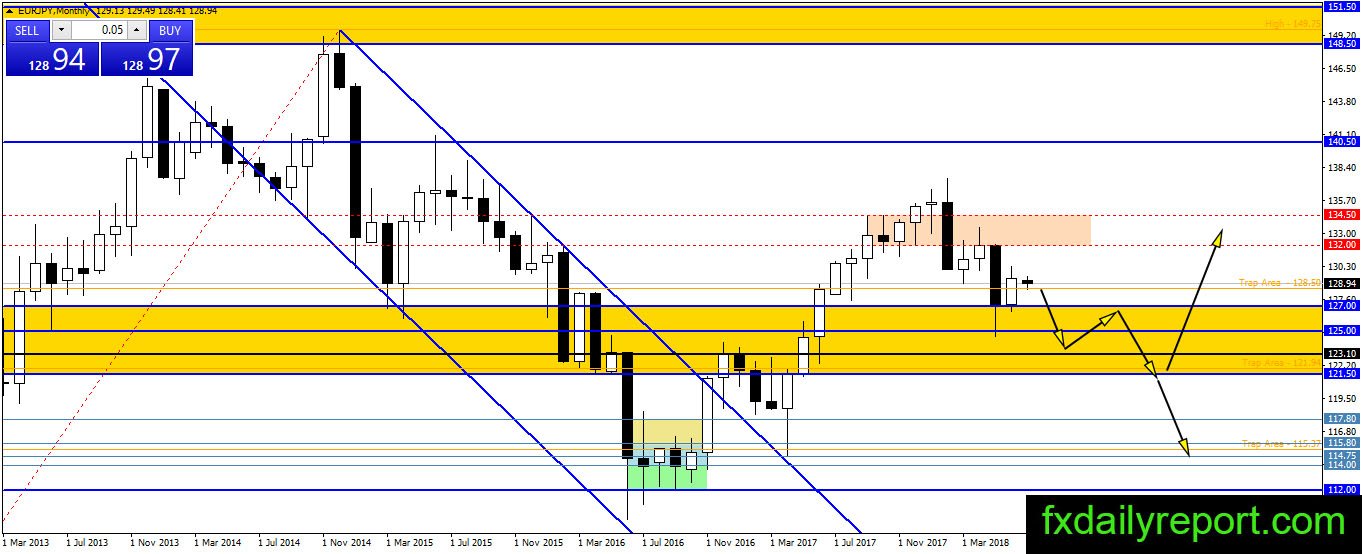
EUR/JPY descended from the pink area and reached 127.00 before it bounced in June. The upward movement is expected, but it closed below the middle of the bearish candlestick. The situation has not turned to bullish, and the pair could start another bearish move toward 125.00.
At the current time, 128.50 is the support level to watch. A closure below the level will trigger more selling.
Weekly Chart
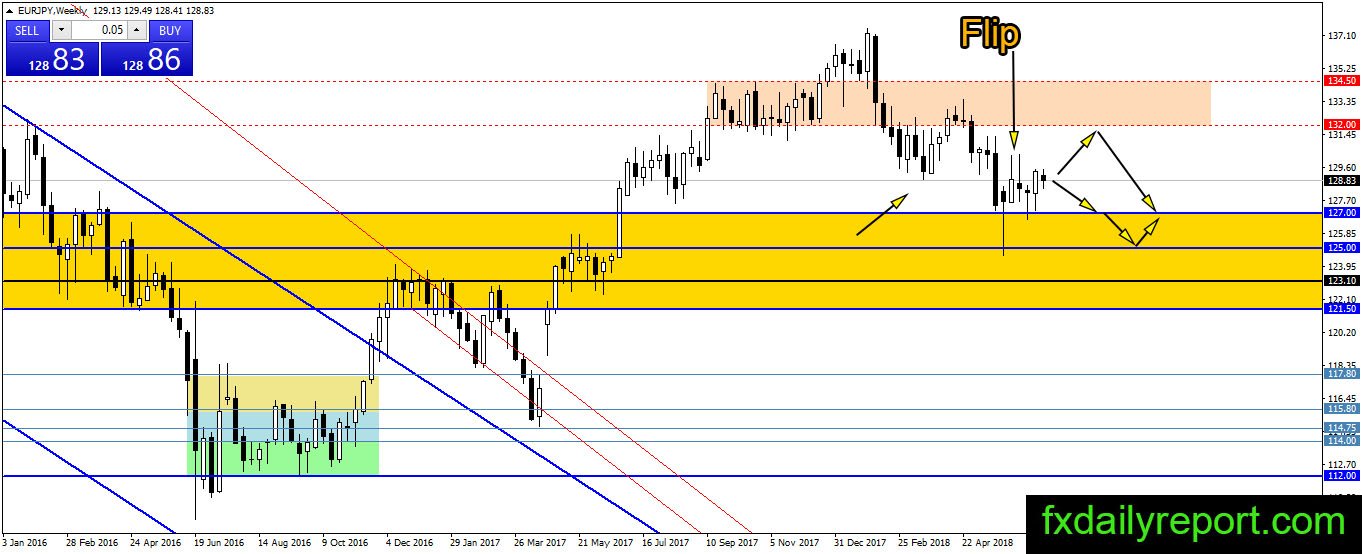
The pair found support at 127.00 and bounced from the level. Disregarding all the wick on the chart, we found EUR/JPY has been trading inside one bearish candlestick for five weeks. The pair is in consolidation period and waiting for next momentum movement. Traders will monitor 127.00 and 130.00 for confirmation.
Daily Chart
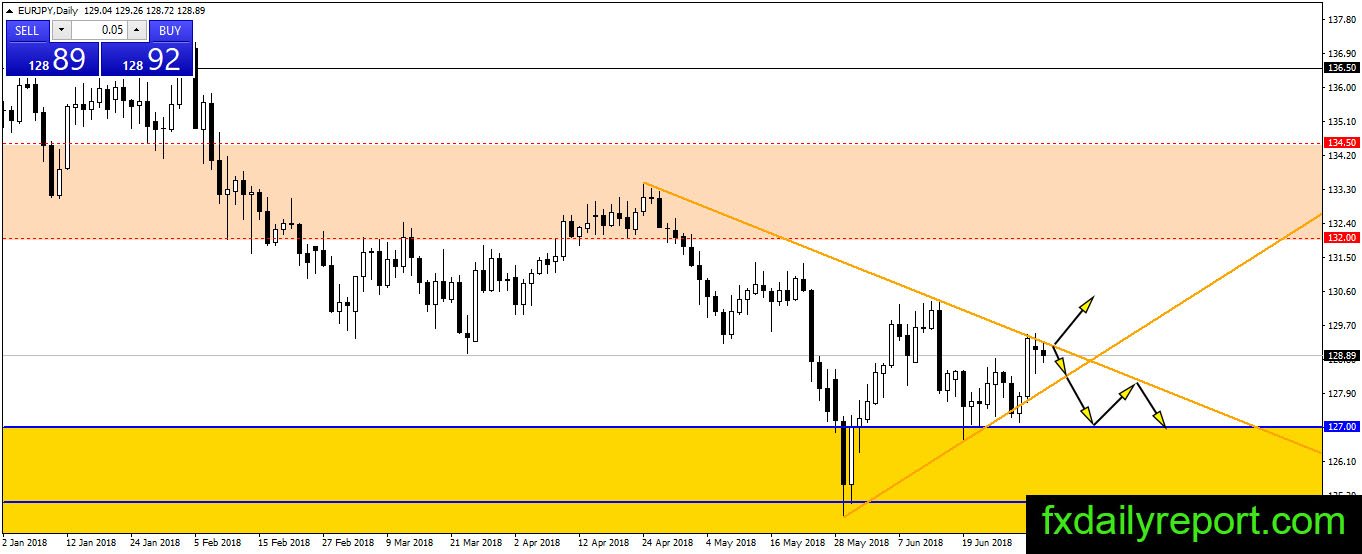
A triangle formed on the EUR/USD daily chart and the pair currently testing the top of the triangle. There is no direction yet for the pair, and we will wait until breakout happen.
Trade plan
The long-term long position could be taken from 125.00. On shorter time frame, 125.00 and bottom of the triangle on the daily chart will come to attention.
A short position could be taken from the top of the triangle on the daily chart.