
The EUR/USD currency pair on Wednesday bounced off weekly lows of about 1.1060 to top 1.1090 after the latest round of German Factory Orders. The currency pair has since pulled back slightly to settle at around 1.1083 and remains several pips below last week’s highs of about 1.1173 following Monday’s massive plunge.
The pair recently bounced off oversold levels of the RSI indicator in the 60-min chart and is now pegged in the median section of the normal trading zone.
EUR/USD Fundamentals Overview

From a fundamental perspective, the EUR/USD currency pair is trading at the back of a relatively busy week following last week’s US non-farm payrolls data. This week, the key economic figures came from Markit PMIs.
On Monday, Italian, French and German Manufacturing PMIs beat expectations of 47.6, 50.5 and 41.9 with 47.7, 50.7 and 42.1, respectively while the Spanish equivalent missed the expectation of 47.5 with 46.8.
On the other hand, the Markit Manufacturing PMI for the EU economic block beat the expectation of 45.7 with 45.9 while Sentix Investor Confidence improved from -13.8 to -4.5. This triggered the beginning of the current EUR/USD recovery the following day.
On Wednesday, German Factory Orders, seasonally adjusted beat the expectations of 0.1% change with 1.3% (MoM) for September while the Markit Services and Composite PMIs also surprised with 51.6 and 48.9 versus an expected figure of 51.2 and 48.6 respectively.
EUR/USD Technical Analysis (the 60-min Chart)
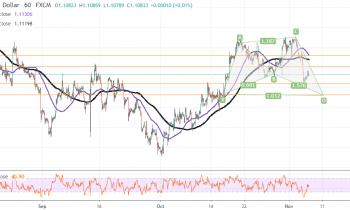
Technically, the EUR/USD currency pair appears to be trading at the back of a XABCD double-top reversal pattern that culminated with Monday’s massive plunge. The currency pair has since bounced off oversold levels in the RSI indicator of the 60-min chart after Tuesday’s and Wednesday’s rebound.
Therefore, the bulls will be targeting short-term profits at around 1.1102 or higher at 1.1129. On the other hand, the bears will hope for a quick pullback towards 1.1060 or lower at 1.1031.
EUR/USD Technical Analysis (the Daily Chart)
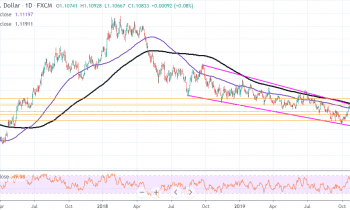
In the daily chart, the EUR/USD currency pair appears to be trading in a slightly descending chart which indicates a long-term bearish bias in the market sentiment. The exchange rate of the pair is now pegged just below the 100-day and the 200-day SMA lines and has recently bounced off the boundary to the overbought zone.
Therefore, the bears will be targeting long-term profits at around 1.1030 or lower at 1.0942. On the other hand, the bulls will hope for an immediate rebound towards 1.1182 or higher at around 1.1277.