
The EUR/USD currency pair on Thursday pulled back to trade at about 1.0084 following Wednesday’s US retail sales data. The currency pair now seems to have completed a downward breakout from a gently ascending channel formation.
The pair has fallen several levels below the 100-hour moving average line in the 60-in chart. As a result, the currency pair on Thursday fell to the oversold conditions of the 14-hour RSI, before mounting a late rebound.
EUR/USD Fundamentals Overview

From a fundamental perspective, the EUR/USD currency pair is trading at the back of a relatively busy period in both markets. On Thursday, the EU harmonised index of consumer prices (HICP) for July matched the expected (MoM) change of 0.1% with 0.1%, while the (YoY) equivalent was in line with 8.9%. The HICP ex-food, energy and air transportation also matched expectations on both (MoM) and (YoY) basis. Earlier in the week, the preliminary EU GDP for Q2 missed the expected 9QoQ) change of 0.7% with a change of 0.6%, while the (YoY) equivalent also came short of 4% with a change of 3.9%.
In the US, the initial jobless claims for the week ending August 12 beat the expected claim count of 265k with a lower tally of 250k. On the other hand, the continuing claims for the preceding week outshone the forecasted tally of 1.438 million with 1.437 million. On Wednesday, the US retail sales control group for July beat the expected change of 0.6% with a change of 0.8%, while general retail sales missed 0.1% with 0% (MoM).
EUR/USD Technical Analysis (the 60-min Chart)
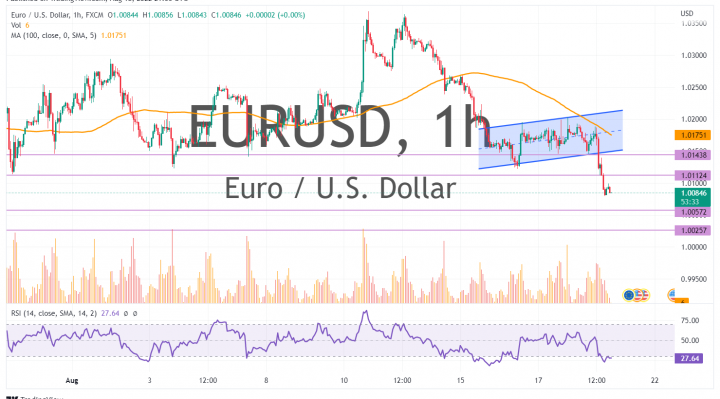
Technically, the EUR/USD currency pair seems to have recently completed a bearish breakout from a gently ascending channel formation in the 60-min chart. This indicates a significant shift in the market sentiment in favour of the bears.
Therefore, they will be looking to stretch the current declines toward 1.0057 or lower to 1.0025. On the other hand, the bulls will look to pounce for profits at about 1.0112, or higher at 1.0143.
EUR/USD Technical Analysis (the Daily Chart)
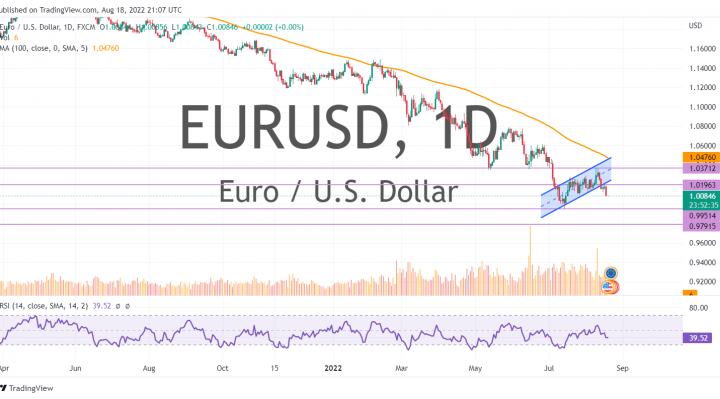
In the daily chart, the EUR/USD currency pair seems to have recently completed a downward breakout from an ascending channel formation. This indicates an attempt by the bears to take control of the pair.
Therefore, the bears will be targeting long-term profits at about 0.9951 or lower at 0.9791. On the other hand, the bulls will look to pounce for rebounds at about 1.0196, or higher at 1.0371.