
The EUR/USD currency pair on Wednesday extended the current weekly declines below the 1.2120 level following the latest round of US CPI. The currency pair continues to trade within a slightly descending channel formation in the 60-min chart.
The currency pair dropped to trade between the 100-hour and the 200-hour SMA lines in the early morning US session. It has now moved closer to oversold levels of the 14-hour RSI. This could trigger a short-term rebound.
EUR/USD Fundamentals Overview

From a fundamental perspective, the EUR/USD currency pair is trading at the back of a relatively busy period in the US market. On Wednesday, the US consumer price index ex-food and energy for April beat the expected (YoY) change of 2.3% with a change of 3%. The (MoM) equivalent also outshone 0.3% with 0.9%. On the other hand, general CPI for the month beat the expectation of 3.6% with a (YoY) change of 4.2% while the (MoM) equivalent outperformed 0.2% with 0.8%.
In the EU, Germany’s harmonized index of consumer prices for April matched the expected (YoY) change of 2.1%. The seasonally-adjusted EU industrial production for April missed the expected (MoM) change of 0.7% with a change of 0.1%. France’s CPI for April missed expectations on both the (YoY) and (MoM) basis while Germany figures came in line.
EUR/USD Technical Analysis (the 60-min Chart)
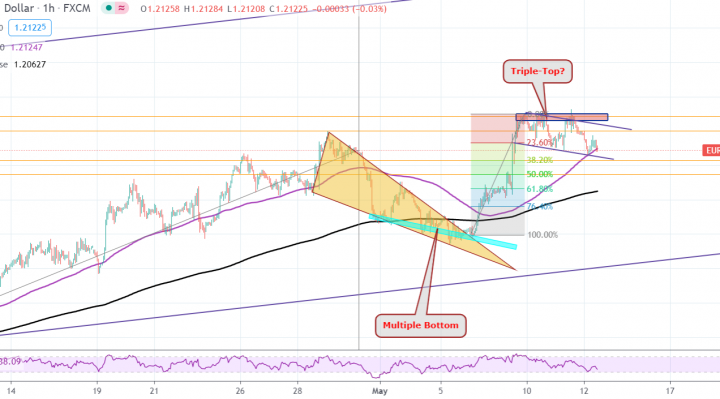
Technically, the EUR/USD currency pair appears to be trading within a gently descending channel formation in the 60-min chart. This indicates a slight short-term bearish bias in the market sentiment.
The bulls will be targeting short-term rebound profits at around 1.2150 or higher at the 0.00% fib level at 1.2172. On the other hand, the bears will look to pounce on potential pullbacks at around 1.2100 or lower at the 38.20% fib level at 1.2080.
EUR/USD Technical Analysis (the Daily Chart)
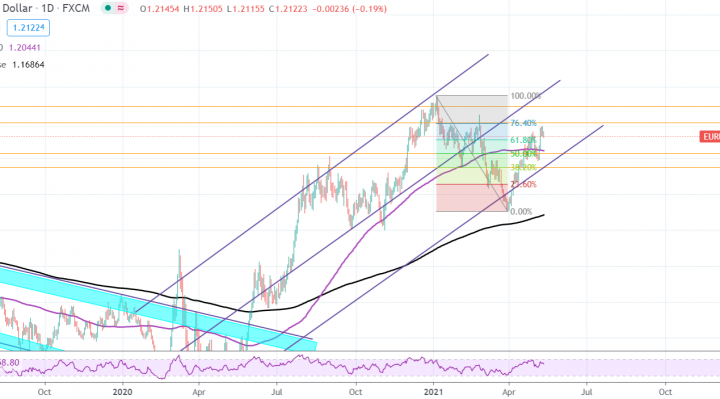
In the daily chart, the EUR/USD currency pair appears to have recently made a bullish recovery from a sharp decline. It is now pinned just above the 61.80% fib level on the way up. It has also climbed closer to overbought levels of the 14-day RSI.
The bulls will be targeting long-term profits at around the 76.40% fib level at 1.2198 or higher at 1.2292. On the other hand, the bears will target potential pullbacks at around 50% and 38.20% fib levels at 1.2028 and 1.1950, respectively.