
EUR/USD long-term technical analysis
EUR/USD closed the year in positive tone after the pair move further upside while U.S dollar index subdued. Kicking-off the year, the pair gain more ground following ECB which turn bullish after a string of better economic data. On the other side, U.S dollar index continues its downward movement and print fresh low below 2017 low.
The market fears especially shown in U.S bond where the yield is ticking up this year. There is news that China pares U.S bond purchase was the cause why bond yield is ticking up. However, there might be an uglier truth. Nevertheless, the situation from fundamental side continue disadvantageous for U.S dollar, and it should push EUR/USD rate higher this year.

Click here to see EUR/USD long-term analysis December 2017
New Month
Monthly chart
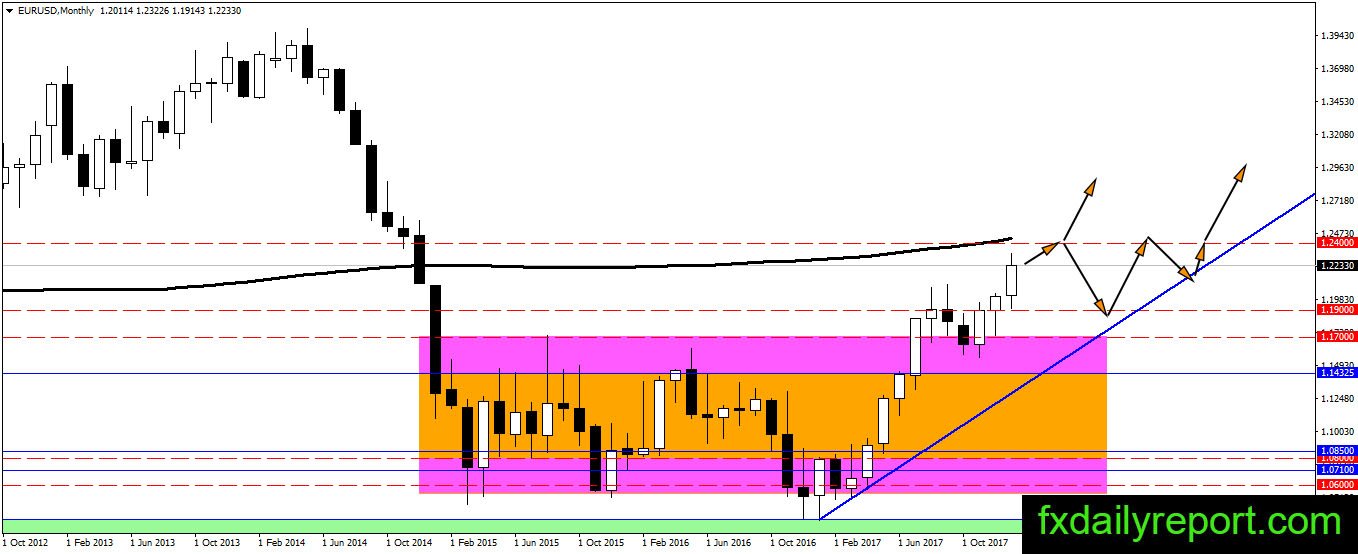
EUR/USD upward movement continues in January 2018 after the pair closed with wider gain above 1.1900. The upward movement almost reached monthly SMA 200 where it will have a test to determine next trend. Traders might want to scale out near the averages and 1.2400 resistance.
Weekly chart
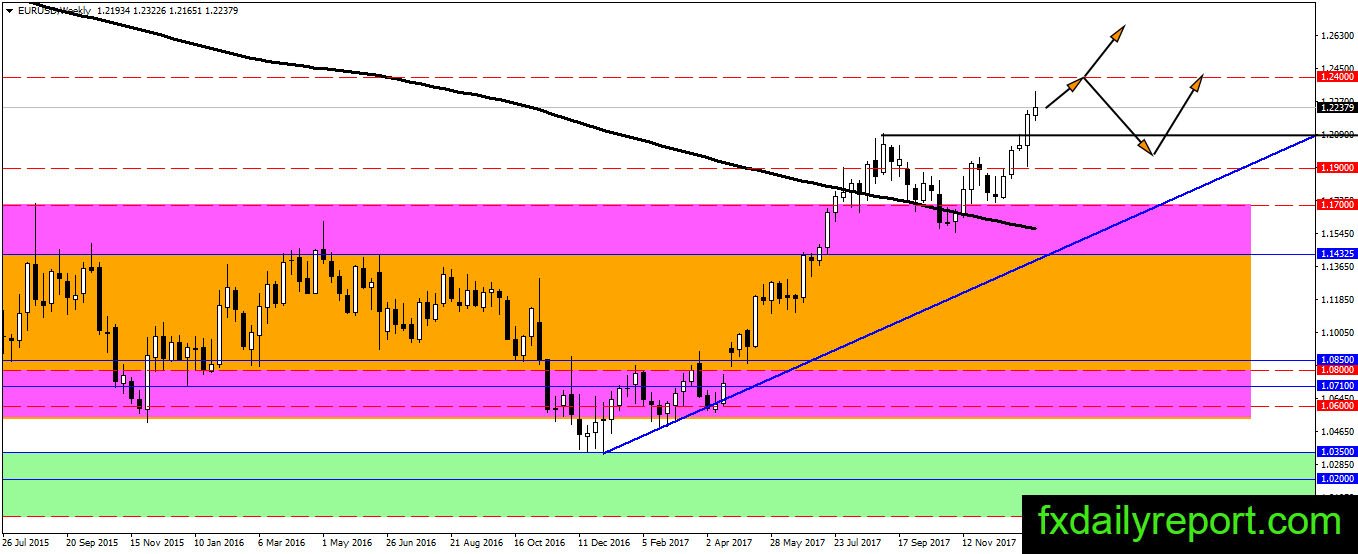
EUR/USD on the weekly chart on track higher to the nearest resistance 1.2400. The pair might experience correction after the resistance touched. Traders could watch 1.1900 – 1.2000 as an area to look for long position when EUR/USD bounce and continue its uptrend.
Daily chart
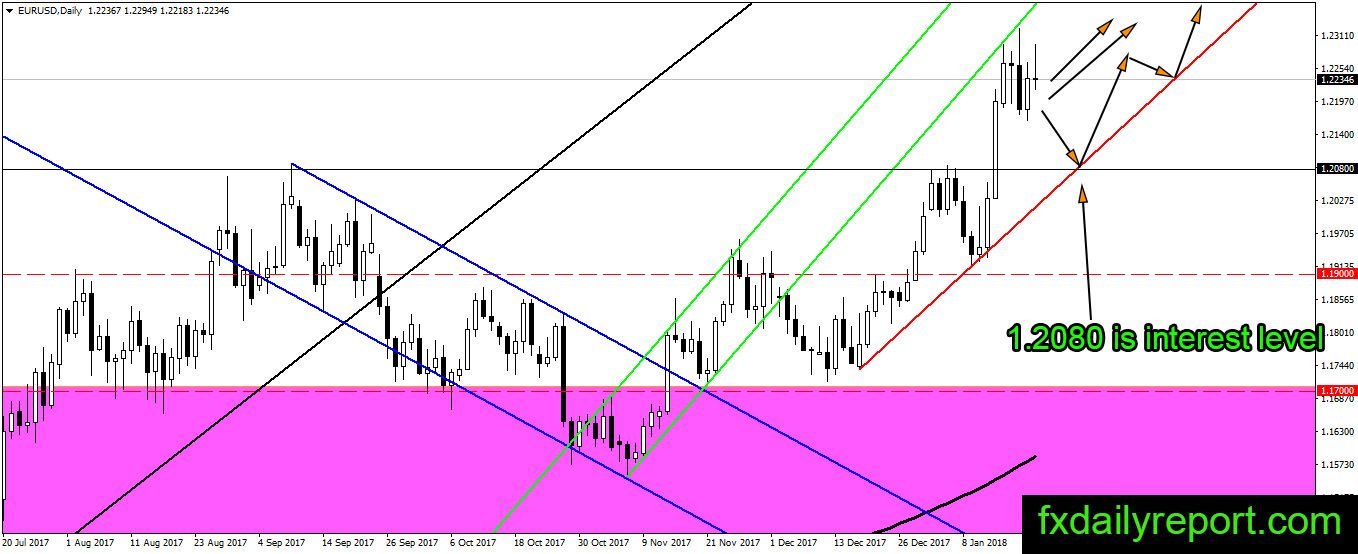
EUR/USD print new fresh high on the daily chart and there is nothing to stop the pair from moving further upside. Long position from 1.2080 or the red trendline is the best setup traders could watch.
Trade plan
The long position could be taken from 1.2080 level and the red trendline on the daily chart.
The short position might need to wait until the pair reaches 1.2400 – 1.2500 and form a strong reversal pattern.