
The EUR/USD currency pair pulled back on Monday to trade just above the 1.1020 level in the process slicing a huge chunk off last week’s gains. The currency pair has been on an upward trending movement since Tuesday last week, but now that appears to have come to an end following Monday’s plunge.
This is the second major pullback in the currency pair this month after performing a bullish reversal pattern at the start of October. The currency pair plunged massively towards the end of September but has since maintained a bullish outlook.
EUR/USD Fundamentals Overview

From a fundamental perspective, the EUR/USD currency pair continues to trade in a bullish movement despite the latest events that seem to support the greenback. The US and China have set things in motion for a potential trade deal after agreeing to meet in what the US President Donald Trump termed as “Phase 1” of the trade deal.
A lack of clear details on the announcement led to a quick fade out of the initial optimism, which explains why the EUR/USD currency pair maintains a bullish outlook in the short-term. In addition, the EU Industrial Production numbers came out mixed for last month, with 0.4% growth on a month-over-month basis beating expectations of 0.3% while the -2.8% decline on a year-over-year basis missed expectations of -2.5%.
The Brexit uncertainty still continues to weigh on the Euro after the UK Prime Minister Boris Jonson revealed that the government is not close to agreeing on a deal. With the US celebrating Columbus Day on October 14, more movement in the pair can be expected from Tuesday when after a resumption to normal business operations.
EUR/USD Technical Analysis (the 60-min Chart)
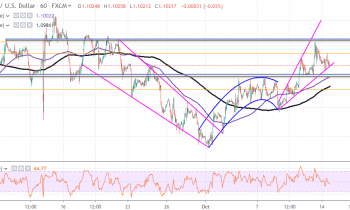
Technically, the EUR/USD currency pair appears to be trading within a bullish wedge that is widening, which indicates a pattern of increasing volatility. The Pair currently trades several pips above the current level of the 100-hour and 200-hour SMAs while the RSI indicator shows that the current movement could continue through this week.
Therefore, the bulls will be targeting short-term profits at around 1.1043 or higher at 1.1062. On the other hand, the bears will be looking to pounce on profits at around 1.1000 or lower 1.0981.
EUR/USD Technical Analysis (the Daily Chart)
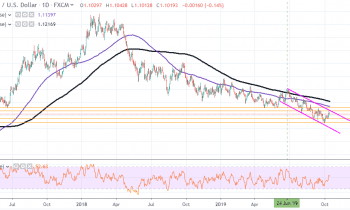
In the daily chart, the EUR/USD currency pair appears to be trading under strong bearish pressure in a descending channel. The currency pair has recently bounced off the trendline support and continues to trade upwards heading towards the trendline resistance.
Therefore, the bears will be targeting the next pullback at around 1.0950 or lower at 1.0887. On the other hand, the bulls will hope that the current trendline resistance can be breached by targeting profits at around 1.1067 or higher at 1.1117.
In summary, the EUR/USD currency pair appears to be trading under short-term bullish pressure but in the long-term, the bears retain control.