
On Thursday, the EUR/USD currency pair pulled back from the session highs of about 1.0415 to trade at about 1.0326. In the 60-minute chart, the pair trades within a descending channel formation.
The pair has now plummeted to trade a few levels below the 100-hour moving average line. As a result, the currency pair trades closer to the oversold levels of the 14-hour RSI.
EUR/USD Fundamentals Overview

From a fundamental perspective, the EUR/USD currency pair trades during a relatively busy period in both markets. On Thursday, Germany’s HCOB Manufacturing PMI for December matched the forecast of 42.5, unchanged from November. The Spanish equivalent missed the expectation of 53.5 with a reading of 53.3, up from the preceding month’s equivalent of 53.1.
On the other hand, the EU’s HCOB Manufacturing PMI for the period edged lower to 45.1, down from 45.2, missing the forecast of 45.2. The EU’s ME Money Supply for the period ending November 30 outshone the forecasted change of 3.5% with a change of 3.8%, up from 3.4% in the preceding month.
In the U.S., the initial jobless claims for the week ending December 27 fell significantly lower to 211k, down from 220k in the preceding week, beating the forecasted claim count of 220k. The continuing claims for the week ending December 20 also outshone the estimate of 1.89 million with a tally of 1.844 million down from 1.896 million. The S&P Global Manufacturing PMI for December exceeded expectations of 48.3 with a reading of 49.4, up from 48.3 in November.
EUR/USD Technical Analysis (the 60-min Chart)
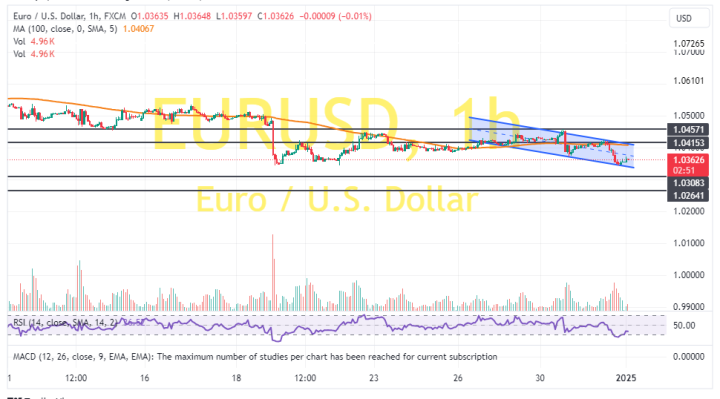
Technically, the EUR/USD currency pair trades within a descending channel formation in the 60-minute chart. The 14-hour RSI has also fallen closer to the oversold conditions of the indicator.
Therefore, the bears will look to stretch the current pullback towards 1.0308 or lower to 1.0264. On the other hand, the bulls will look to pounce on rebounds at about 1.0415 or higher at 1.0457.
EUR/USD Technical Analysis (the Daily Chart)
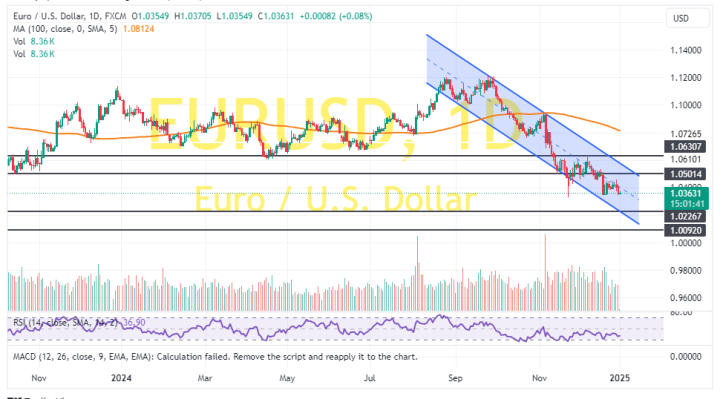
In the daily chart, the EUR/USD currency pair trades within a descending channel formation. The 14-day RSI also supports a long-term bearish bias as it edges closer to the oversold conditions.
Therefore, the bears will be targeting long-term decines at about 1.0226 or lower at 1.0092. On the other hand, the bulls will look to pounce on profits at about 1.0501 or higher at 1.0630.