
On Wednesday, the EUR/USD currency pair pulled back from the session highs of about 1.0927 to trade at about 1.0889. The currency pair trades within an ascending channel formation in the 60-minute chart.
The currency pair continues to trade above the 100-hour moving average line despite the pullback. Wednesday’s pullback prevented the pair from ascending into the overbought levels of the 14-hour RSI.
EUR/USD Fundamentals Overview

From a fundamental perspective, the EUR/USD currency pair trades during a relatively busy period in both markets. On Wednesday, the U.S. consumer price index for February missed the (MoM) expectation of 0.3% with 0.2%, down from 0.5% in the preceding month. The (YoY) equivalent also fell short of 2.9% with 2.8%, down from 3% in January.
On the other hand, the consumer price index ex-food and energy failed to match the estimate of 0.3% (MoM) and 3.2% (YoY), reporting actual figures of 0.2% and 3.1%, respectively, compared to the preceding month’s equivalent of 0.4% and 3.4%.
In the EU, Germany’s seasonally adjusted industrial production for January beat the forecasted (MoM) change of 1.5% with a change of 2%, up from the previous month’s equivalent change of -1.5%. The (YoY) equivalent also improved to -1.6% up from -2.2% in December, while the trade balance for the month missed the forecast of EUR 21 billion with EUR 16 billion, down from the preceding month’s equivalent of EUR 20.7 billion. The EU’s Sentix Investor Confidence for March improved to -2.9 up from -12.9.
EUR/USD Technical Analysis (the 60-min Chart)
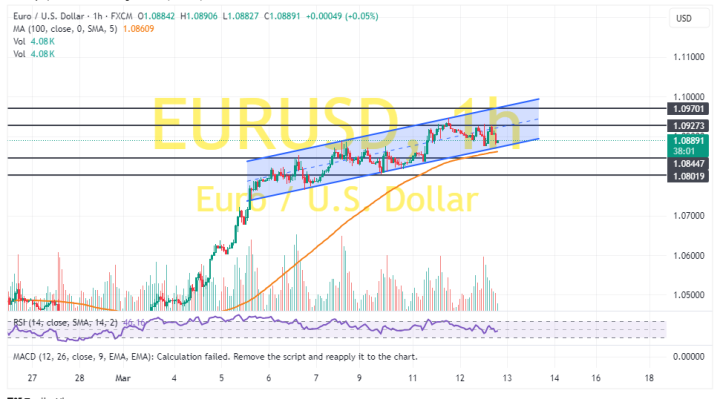
Technically, the EUR/USD currency pair trades within an ascending channel formation in the 60-minute chart. However, the 14-hour RSI has recently pulled back to avoid rallying into the overbought conditions.
Therefore, the bears will look to extend the current pullback towards 1.0844 or lower to 1.0802. On the other hand, the bulls will look to pounce on extended gains at about 1.0927 or higher at 1.0970.
EUR/USD Technical Analysis (the Daily Chart)
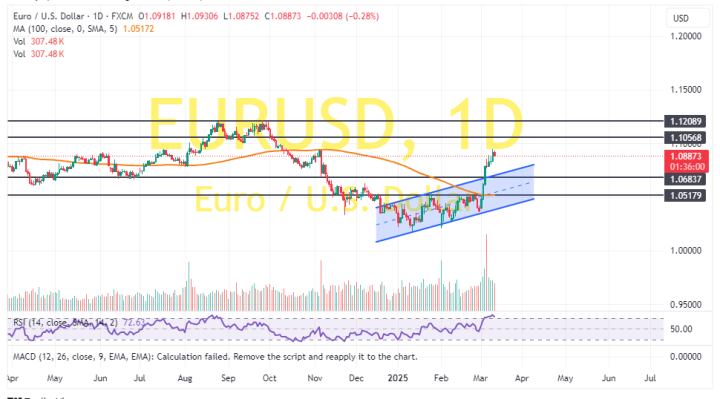
In the daily chart, the EUR/USD currency pair has completed an upward breakout from an ascending channel formation. The 14-day RSI also supports a long-term bullish bias after rallying into overbought conditions.
Therefore, the bulls will look to stretch the current rally towards 1.1056 or higher to 1.1209. On the other hand, the bears will look to pounce on profits at about 1.0683 or lower at 1.0517.