
On Tuesday, the EUR/USD currency pair pulled back from the session highs of about 1.1590 to trade at about 1.1552 after the latest EU data. The currency pair trades within a descending channel formation in the 60-minute chart.
Tuesday’s pullback pushed the currency pair a few levels below the 100-hour moving average line. However, the pair has some room left to run before reaching the oversold conditions of the 14-hour RSI.
EUR/USD Fundamentals Overview

From a fundamental perspective, the EUR/USD currency pair trades during a relatively busy period in the EU market. On Tuesday, the German consumer price index for September matched the (MoM) and (YoY) expectations of 0.2% and 2.4%, respectively. The harmonised index of consumer prices was also in line with the estimates of 0.2% (MoM) and 2.4% (YoY).
The country’s ZEW survey for the current situation in October missed the expectation of -75 with a reading of -80, up from -76.4. The ZEW survey for economic sentiment for the period also fell short of 40.5, with a reading of 39.3, up from 37.3. The EU’s ZEW survey for economic sentiment for the month also fell short of the forecasted reading of 30.2, with a reading of 22.7, down from 26.1.
In the U.S., the NFIB business optimism index for September missed the expected reading of 100.5, with a reading of 98.8, down from 100.8. Looking forward, traders will be waiting for the NY Empire State Manufacturing Index data for October on Wednesday, ahead of the initial jobless claims data on Thursday.
EUR/USD Technical Analysis (the 60-min Chart)
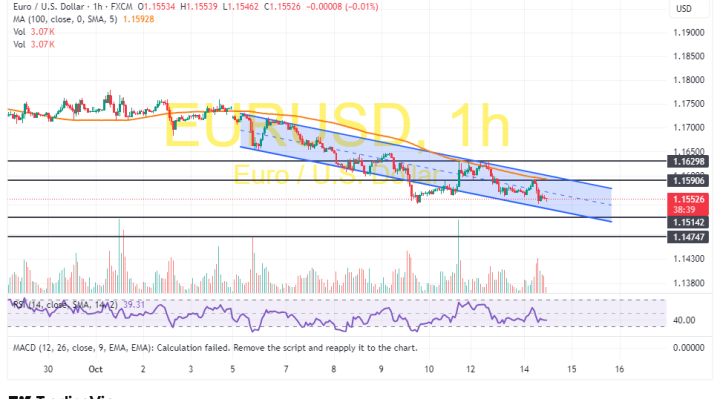
Technically, the EUR/USD currency pair trades within a descending channel formation in the 60-minute chart. However, the 14-hour RSI still has room left to run before reaching oversold conditions.
Therefore, the bears will look to extend the current pullback towards 1.1514 or lower to 1.1474. On the other hand, the bulls will look to pounce on profits at about 1.1590 or higher at 1.1679.
EUR/USD Technical Analysis (the Daily Chart)
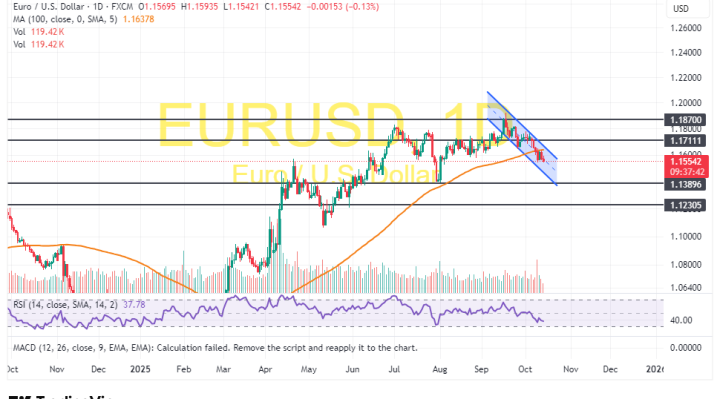
In the daily chart, the EUR/USD currency pair trades within a descending channel formation. However, the 14-day RSI still has room left to run before reaching oversold conditions.
Therefore, the bears will look to extend the current run of declines toward 1.1389 or lower to 1.1230. On the other hand, the bulls will look to pounce on rebounds at about 1.1711 or higher at 1.1870.