
The EUR/USD currency pair on Friday bounced off the trendline support at 1.1789 to surge towards 1.1855 before pulling back late on to settle at 1.1830. The currency pair appears to have recently completed a head-and-shoulders pattern formation in the 60-min chart.
It is now pinned just above the 100-hour SMA while the 200-hour SMA is several levels lower. Friday’s late pullback prevented the pair from crossing to overbought levels of the 14-hour RSI.
EUR/USD Fundamentals Overview

From a fundamental perspective, the EUR/USD currency pair is trading at the back of a relatively busy period in both markets. The US market is beginning to heat up amid the Q3 earnings season ahead of next month’s presidential election. Based on the latest US economic data, the preliminary US Markit Manufacturing PMI for October missed the expectation of 53.4 with 53.3. On the other hand, the Markit Services PMI beat the expectation of 54.6 with 56. On Thursday, both the initial and continuing jobless claims outperformed expectations.
In the EU, the preliminary EU Markit manufacturing PMI for October beat the expectation of 53.1 with 54.4. The Markit PMI Composite also outperformed 49.3 with 49.4 while the Services PMI missed 47 with 46.2. On Thursday, the preliminary Consumer Confidence for October missed the expectation of -15 with -15.5.
EUR/USD Technical Analysis (the 60-min Chart)
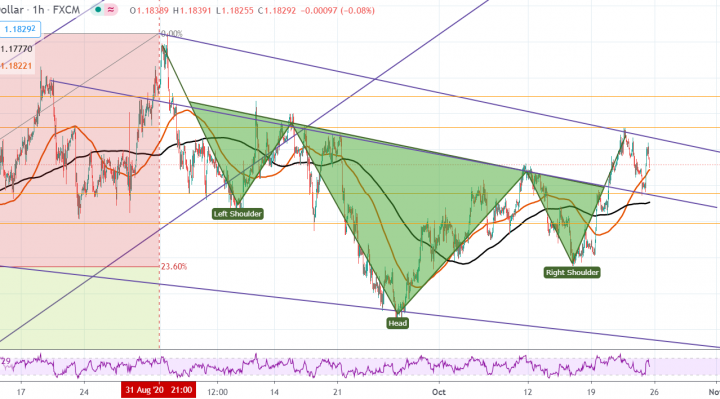
Technically, the EUR/USD currency pair appears to be attempting an upward reversal following the completion of a head-and-shoulders pattern. The currency pair rallied on Friday closer to overbought levels of the 14-hour RSI in the 60-min chart. It later pulled back to avoid crossing over.
The bears will be looking to build on this late pullback by targeting short-term profits at around 1.1789 or lower at 1.1747. On the other hand, the bulls will target profits at around 1.1880 or higher at 1.1924.
EUR/USD Technical Analysis (the Daily Chart)
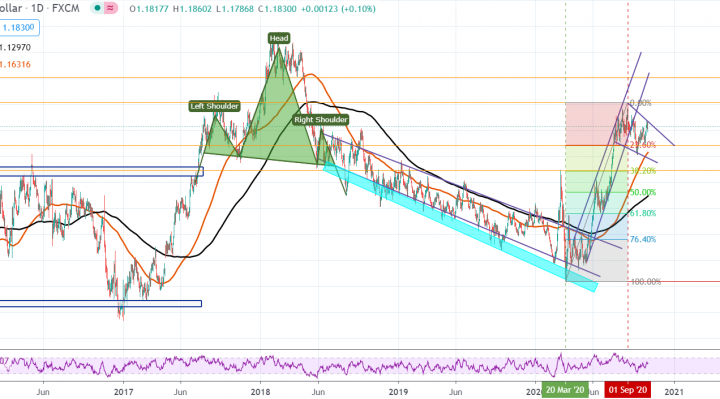
In the daily chart, the EUR/USD currency pair appears to be pulling back after hitting a new 30-month high of 1.2014. It has now pulled back about 11.80% in the daily chart.
The bears will be looking to extend the current pullback towards 23.60% and 38.20% fib levels at 1.1682 and 1.1491, respectively. On the other hand, the bulls will target long-term profits at around 0.00% fib level at 1.2014 or higher at 1.2207.