
The EUR/USD currency pair on Friday pulled back off the current weekly highs of about 1.1760 to trade at around 1.1700 amid increased bearish pressure. The pair made a temporary rebound in the late afternoon to trade at 1.1714 after the announcement of the US non-farm payrolls.
The currency pair is now pinned to the 100-hour SMA in the 60-min chart. The 200-hour SMA is a few levels below. It continues to trade in a consolidative pattern formation, with a slight bearish bias.
EUR/USD Fundamentals Overview

From a fundamental perspective, the EUR/USD currency pair is trading at the back of a relatively busy period in the US market. On Friday, the US non-farm payrolls for September missed the expectation of 850k with 661k jobs. Average hourly wage growth for the period also came short of the (YoY) expectation of 4.8% with 4.7%. The (MoM) equivalent missed 0.2% with 0.1%.
On a positive note, the unemployment rate edged lower to 7.9% down from 8.4% in August. The market was expecting it at 8.2%. The Michigan Consumer Sentiment Index for September beat the expectation of 79 with 80.4. On the other hand, the factory orders for August missed the (MoM) expectation of 1% with 0.7%.
In the EU, the preliminary consumer price index for Sep. missed the (YoY) expectation of 0.5% with 0.2%. The (MoM) equivalent missed the expected change of -0.2% with -0.3%.
EUR/USD Technical Analysis (the 60-min Chart)
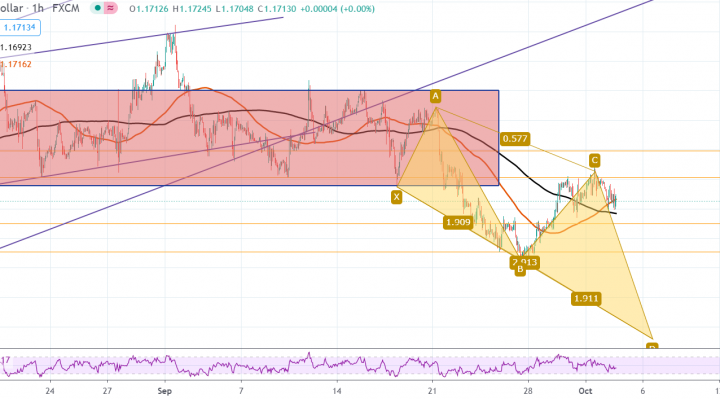
Technically, the EUR/USD currency pair appears to have recently pulled back in a XABCD pattern formation. The pair continues to experience downward pressure in the 60-min chart. This indicates a relatively short-term bearish bias in the market sentiment.
The bears will look to extend the current declines towards 1.1674 or lower at 1.1627. On the other hand, the bulls will target short-term bullish profits at around 1.1752 or higher at 1.1798.
EUR/USD Technical Analysis (the Daily Chart)
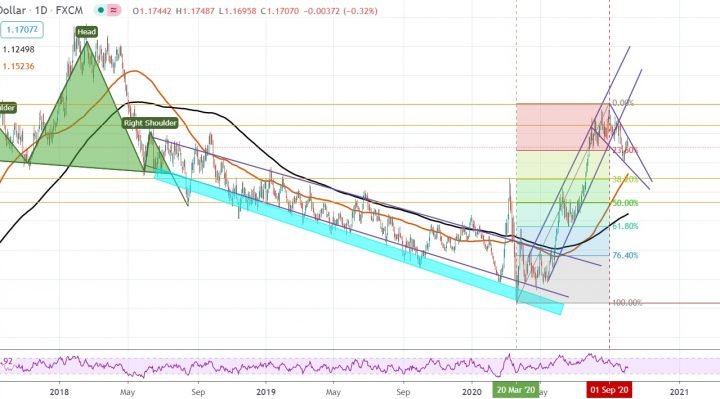
In the daily chart, the EUR/USD currency pair appears to be trading in a sharply descending wedge. The pair has now pulled back closer to the 23.60% fib level after a massive rally between March and September.
The bulls will target long-term profits at around 1.1861 or higher at 0.00% fib level at 1.2004. On the other hand, the bears will target profits at around 38.20% and 50% fib levels at 1.1491 or and 1.1331, respectively.