
The EUR/USD currency pair on Friday pulled back off the current weekly highs of about 1.2162 to trade at around 1.2116 after the Michigan consumer sentiment index data. The currency pair appears to be on course to complete a XABCD double-top reversal pattern.
The pair is pinned to the 100-hour SMA while the 200-hour SMA is a few levels below. The latest pullback prevented the pair from crossing to overbought levels of the 14-hour RSI in the 60-min chart. It is now positioned centrally in the RSI.
EUR/USD Fundamentals Overview

From a fundamental perspective, the EUR/USD currency pair is trading at the back of a relatively busy period in both markets. On Thursday, the European Union finally agreed on a EUR 1.1 trillion budget and EUR 750 billion coronavirus recovery fund. The ECB kept the base interest rate unchanged at 0.0% while the deposit rate remains pinned at -0.5%. The EU Q3 gross domestic product missed the expected (QoQ) change of 12.6% with a change of 12.5%. The (YoY) equivalent outperformed -4.4% with a change of -4.3%.
In the US, the preliminary Michigan Consumer Sentiment Index for December beat the expectation of 76.5 with 81.4. On the other hand, the US producer price index ex-food and energy for November missed the expected (Yoy) change of 1.5% with a change of 1.4%. The (MoM) equivalent missed 0.2% with a change of 0.1%. Earlier in the week, the US CPI ex-food and energy for November beat the (MoM) expectation of 0.1% with 0.2% while the (YoY) equivalent matched expectations of 1.6%.
EUR/USD Technical Analysis (the 60-min Chart)
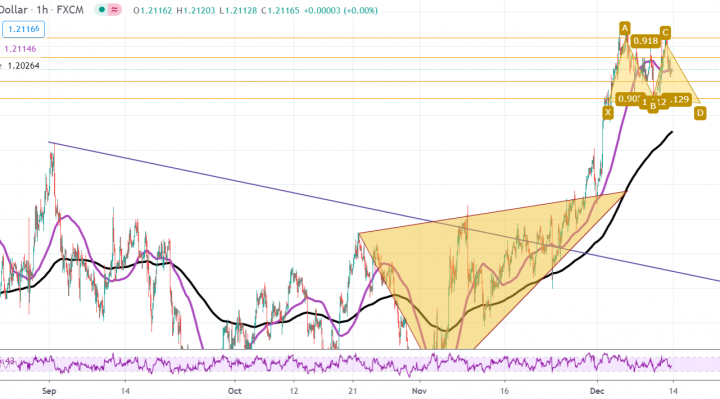
Technically, the EUR/USD currency pair appears to have recently pulled back to halt a sharp bull-run. The pair is now on course to complete a XABCD double-top reversal pattern following Friday’s pullback.
The bulls will be targeting short-term rebound profits at around 1.2134 or higher at 1.2161. On the other hand, the bears will look to pounce for profits at around 1.2089 or lower at 1.2074.
EUR/USD Technical Analysis (the Daily Chart)
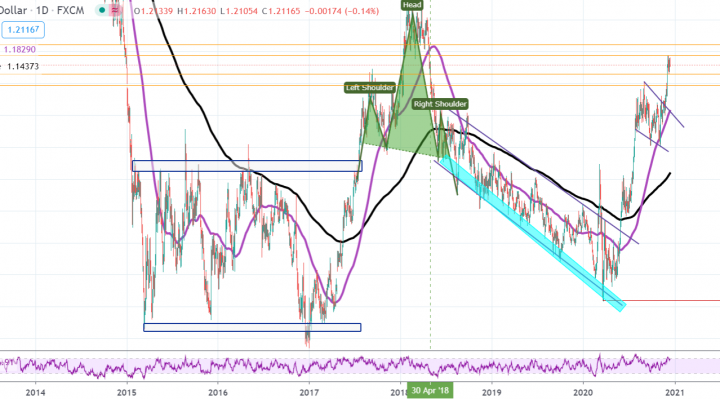
In the daily chart, the EUR/USD currency pair appears to be trading in a sharply ascending curve amid strong bullish pressure. The pair has recently pulled back to halt the bull-run. It is now closer to the normal trading zone of the 14-day RSI after hitting overbought levels.
The bulls will be looking to extend the current long-term gains towards 1.2176 or higher at 1.2242. On the other hand, the bears will target long-term pullbacks at around 1.2057 or lower at 1.1987.