
XOM Long-term outlook
The month of March initiated by a gain in XOM share prices after it tumbled for two consecutive months. The gain comes after upgrade given by Credit Suisse from “Underperform” to “Neutral,” but quickly hammered by HSBC reiterated rating to “Hold.”
Exxon has an aggressive growth plan for 2017 to beat the ongoing commodity slump. This plan expected to give result in 2017 and put the company in advantage. Traders could expect the share price of XOM start its road upward.

Click here to see XOM March analysis
New Month
Monthly chart
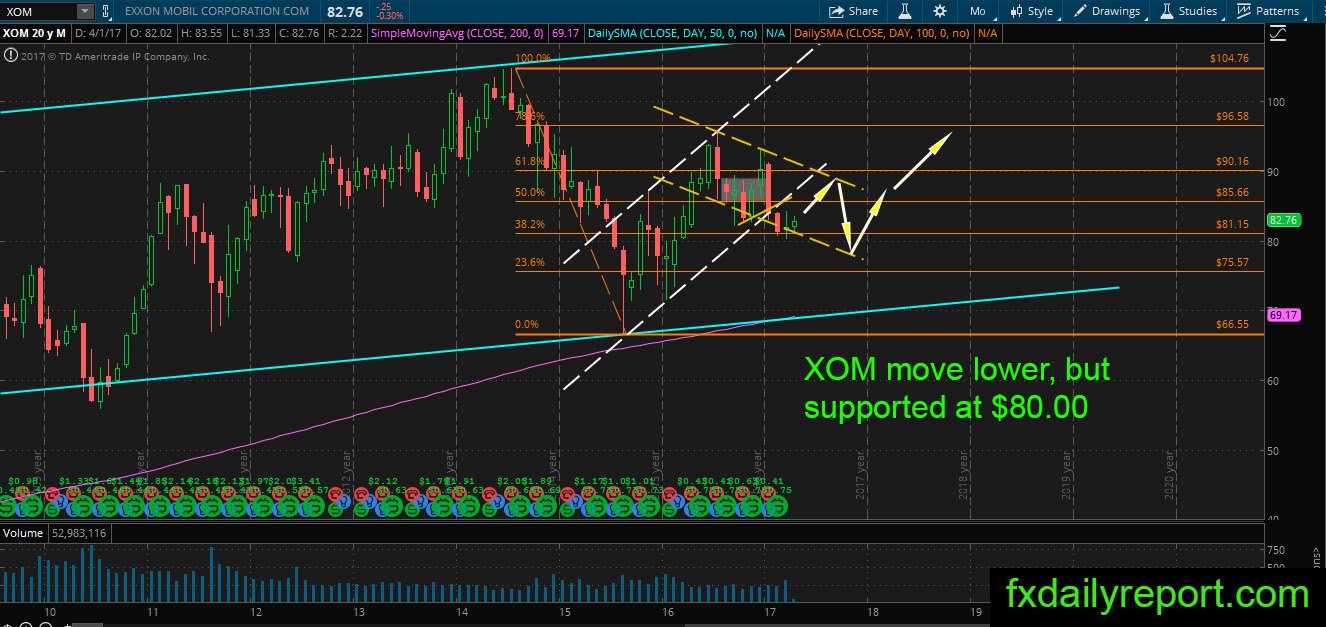
A move lower happened in March and followed by gain, but at the end of the month, XOM settled near its opening price. The downward pressure slowly diminished as April kick starts with bullish movement. Current XOM level is near the bottom of the channel which is the best place to look for a long position.
If the price could bounce from the current level, it might continue higher and reach the top of the channel.
Weekly chart
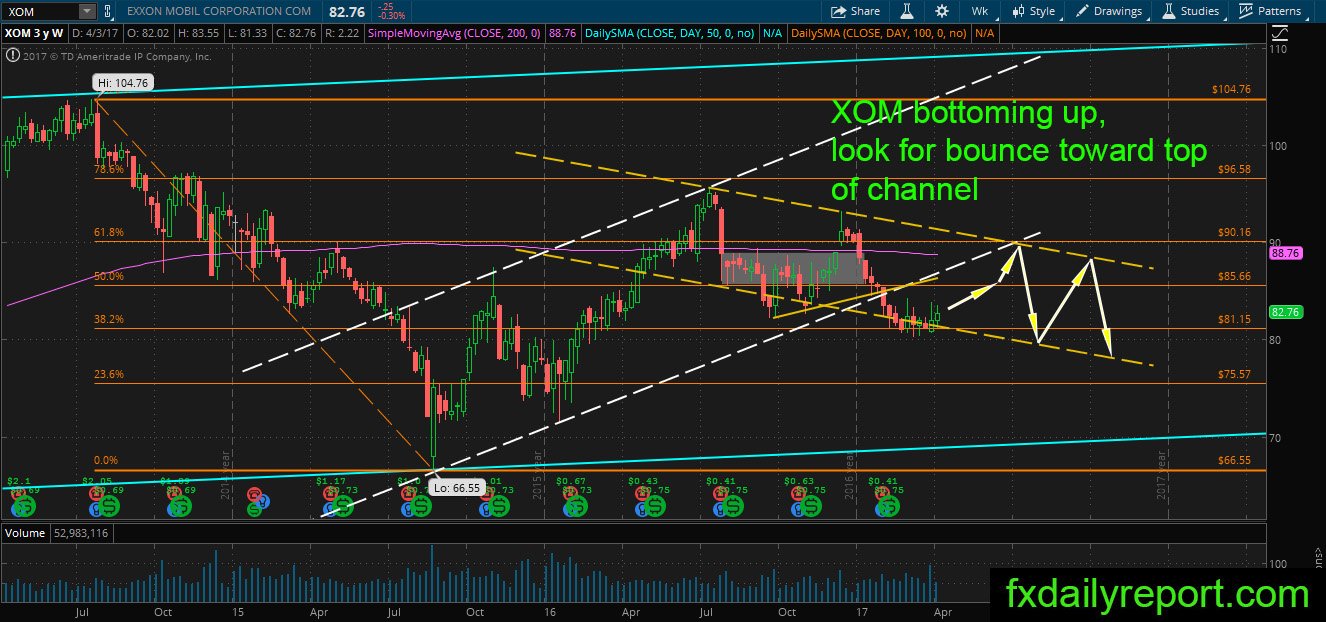
Bottoming up process shown in XOM weekly chart. The price supported near the bottom of the channel, and it also supported by the fundamental view. A bull trader could look for a long position above $83.87 (Two weeks inside bar pattern) with the target around $90.
Daily chart
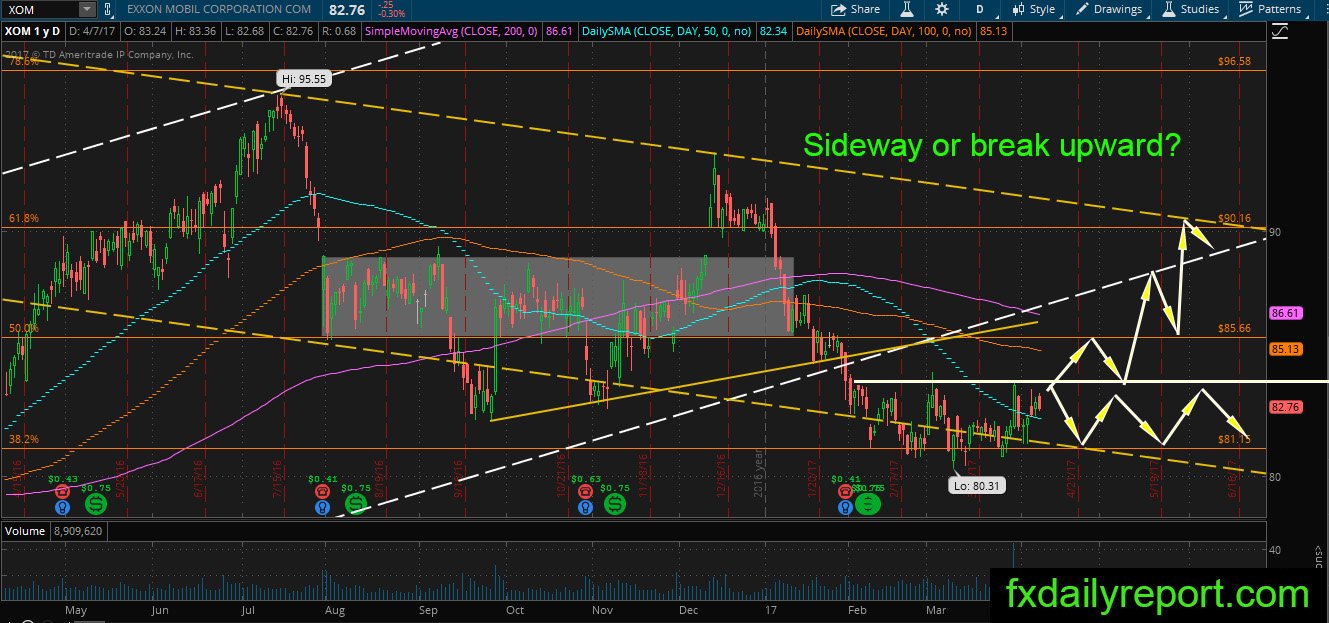
The daily chart of XOM is hovering between $81.15 – $84 and looks to break upside. Even though it looks will break upside, the current trend of XOM still bearish as the price stay below daily SMA 200. If the price manages to close above $84, it will encounter $85.66 as resistance.
Trade plan
The bullish trade could be taken after a break above $84.00 with a stop below $81.15.
The bearish trade could be taken near $84 handle if the price form bearish pattern.