
XOM Long-term outlook
Since the start of January, the direction of XOM shares only down which give a grim impression on the company futures. Weekly chart show six weeks consecutive bearish candlestick and only it already slides almost 10% from $90.94 to $82.30.
The weak performances of XOM happened due to indecision in the oil market and shift of major policies in U.S market. There is a vote by the senate to annul the Securities and Exchange Commission’s resource extraction rule which signed by President Trump. Initially, the rules were controversial, and the change might give an edge to big oil companies but not much.

Analysts mentioned the dip in XOM share price provide buying opportunity as it is rare for the stock to underperform while oil price is moving up. While it is true, dip in stock price will provide cheaper entry for traders, and we will need to assess how the stock perform from the technical side and avoid any fraudulent possibility.
In XOM case,
Click here to see XOM January analysis
New Month
Monthly chart

Development in the monthly chart of XOM is quite disappointing for the bull. The price slipped lower below the support channel and risked the change into a bearish trend. The bull needs to close the price back inside the channel before the end of February. Otherwise, we will see movement toward blue channel low.
Weekly chart
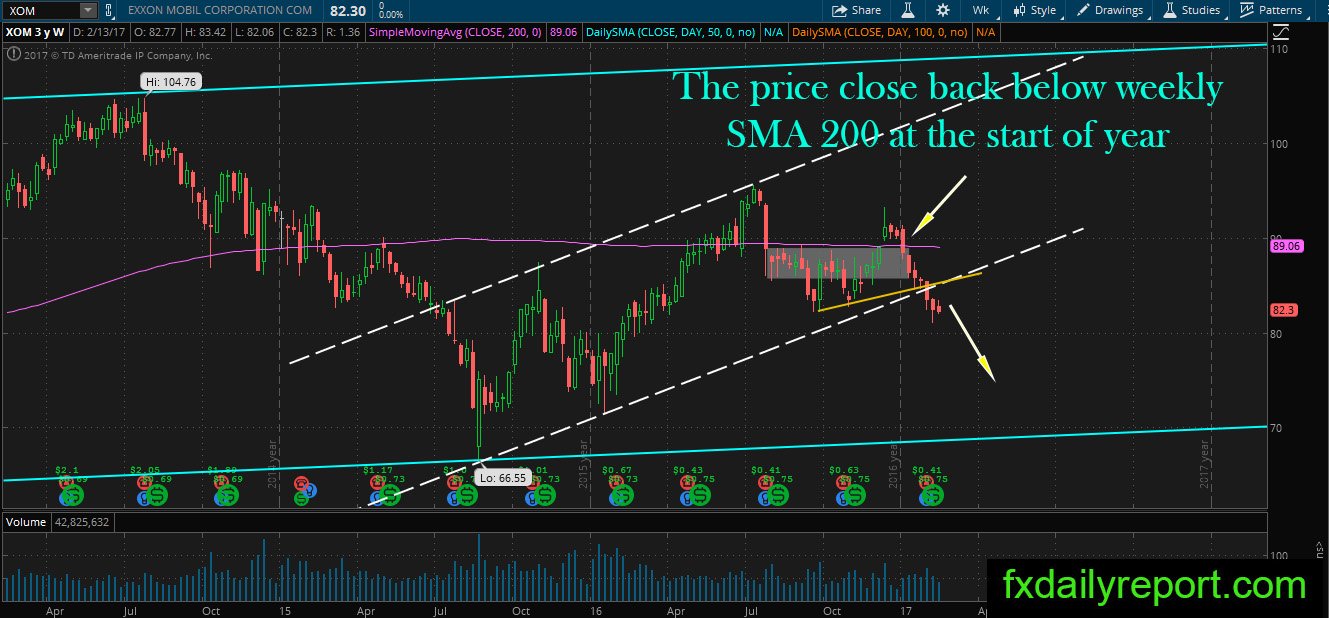
The bearish trend started when the price closed back below its weekly SMA 200. Since the close below the averages, XOM direction is down and no bullish candlestick formed yet. Without any stop on the downward movement, it is better for traders to avoid placing long position in the stock.
Daily chart
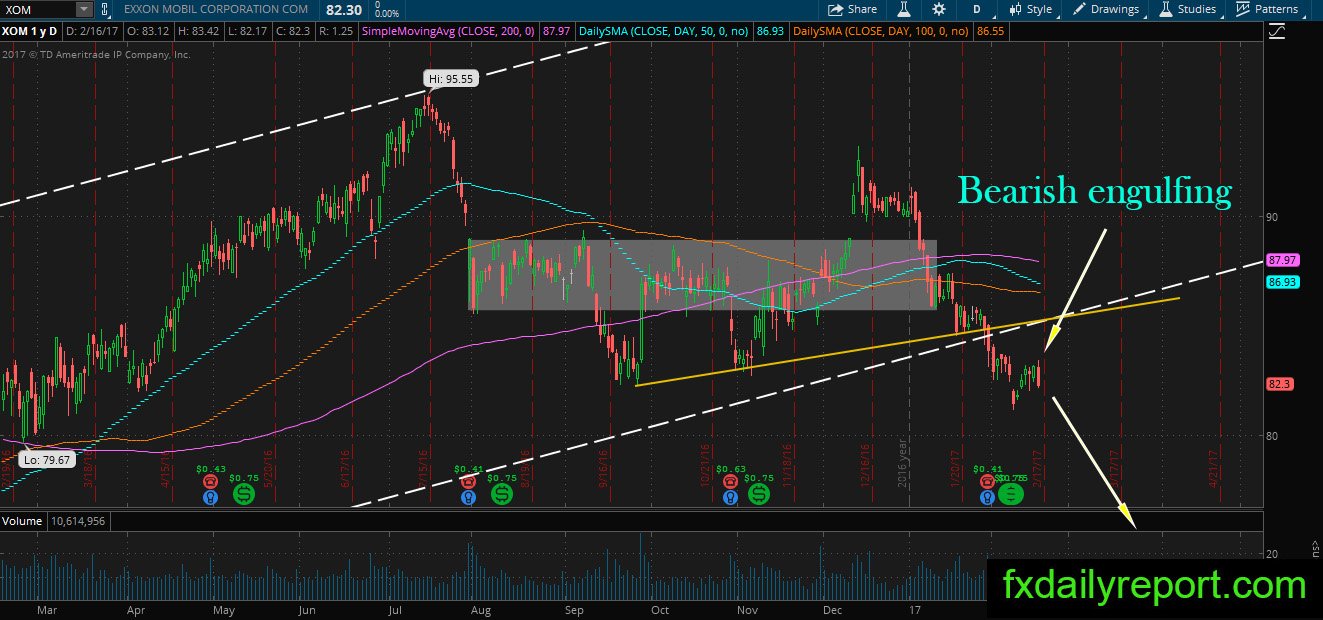
The daily chart of XOM show failure of yellow trendline and also the white bullish channel. The bearish movement looks to continue as the bearish engulfing pattern formed even though the formation near extreme low. If the price manages to close below $81 support level, XOM should decline further and extremely bearish.
Trade plan
Bullish trade is not favorable this time, $80-$81 is strong support for the stock, but may not hold the bearish pressure for long-term.
The bearish trade could be taken after test of broken trendline or channel.