
XOM Long-term outlook
Oil price influence the XOM shares in the month of December. The share price of XOM shot up following the advance of oil price and printed high of $93.22. Unfortunately, entering January 2017, it starts to drift lower as crude oil stuck below $54.50 resistance level.
2017 will be a critical year for XOM as crude oil price predicted will move higher after last year OPEC agreement to cut production. However, the storm has not passed yet as President Trump policy also expected to put big overhaul in the economic system.

The first quarter of 2017 might become a wait and see period until all uncertainties about policy are solved.
Click here to see XOM December analysis
New Month
Monthly chart
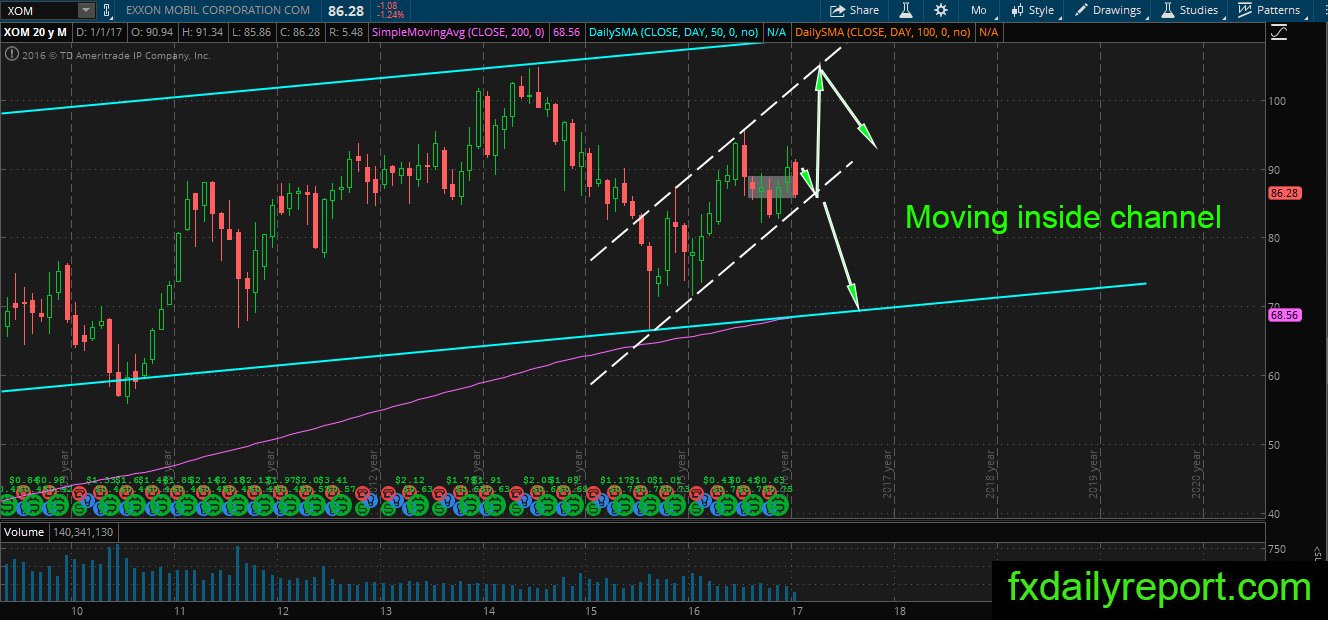
While January kickstart by the bear, XOM in the long-term chart still show a bullish trend. The retreat in January might continue in February to test the lower part of the stock’s bullish channel. If it manages to close inside the channel again, it will diminish bearish pressure and continue the bullish trend.
Weekly chart
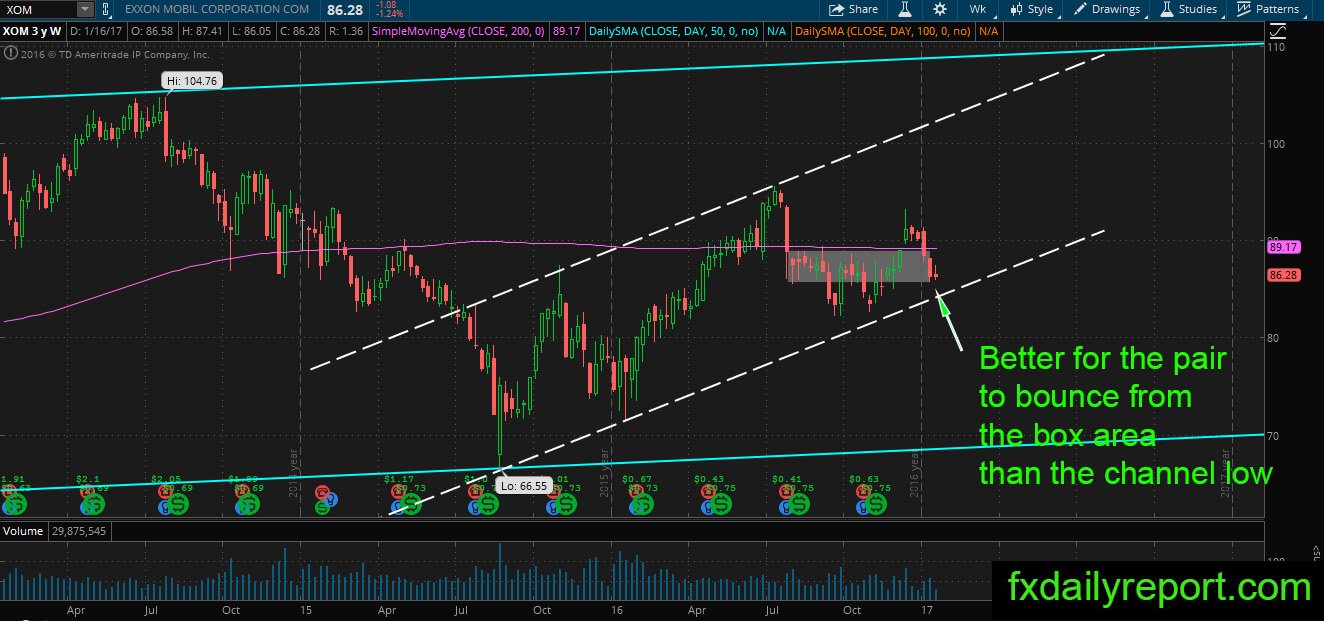
It is unfortunate for the price to close back lower below its WSMA 200, and it needs to bounce from the bottom part of the box. Otherwise, XOM has more risk to move lower and break below the bullish white channel. $85 – $85.8 is the next support level which will be challenged by the bear.
Daily chart

The daily chart of XOM is mildly bearish as the price close below the averages. It needs to remove all averages before the price can turn up back into bullish trend. Meanwhile, it is expected to move inside the small upward channel.
Trade plan
Bullish trade is not favorable this time, but traders can watch how the price react at the White bullish channel or when the price break and retest the averages in the daily chart.
The bearish trade could be taken from the test of daily averages with the target the lower part of the white bullish channel.