
XOM Long-term outlook
Exxon share prices gained $2.05 or 2.5% in October. The advance of XOM share prices incited by better earnings report. The company reported earnings per share of $0.93 vs. $0.89 expectation. Revenue come out at $66.16b vs. $63.39b expectation.
Another factor which contributed to XOM share prices appreciation was higher oil prices. This month, the bear is in control as OPEC meeting loom on 30th November. The meeting will discuss the extension of production cap policy and evaluation on the oil prices.

XOM futures performance will depend on the result of the meeting. The market is cautiously optimistic OPEC will extend the production cap.
Click here to see XOM October analysis
New Month
Monthly chart

The prevailing trend of XOM on the monthly chart stay bearish for medium-term. Although the long-term trend is bullish, there is no sign the share prices will resume the bullish trend yet. XOM in October closed above the bullish candlestick printed in September. However, November looks will end lower and trigger more selling on the XOM shares.
Weekly chart
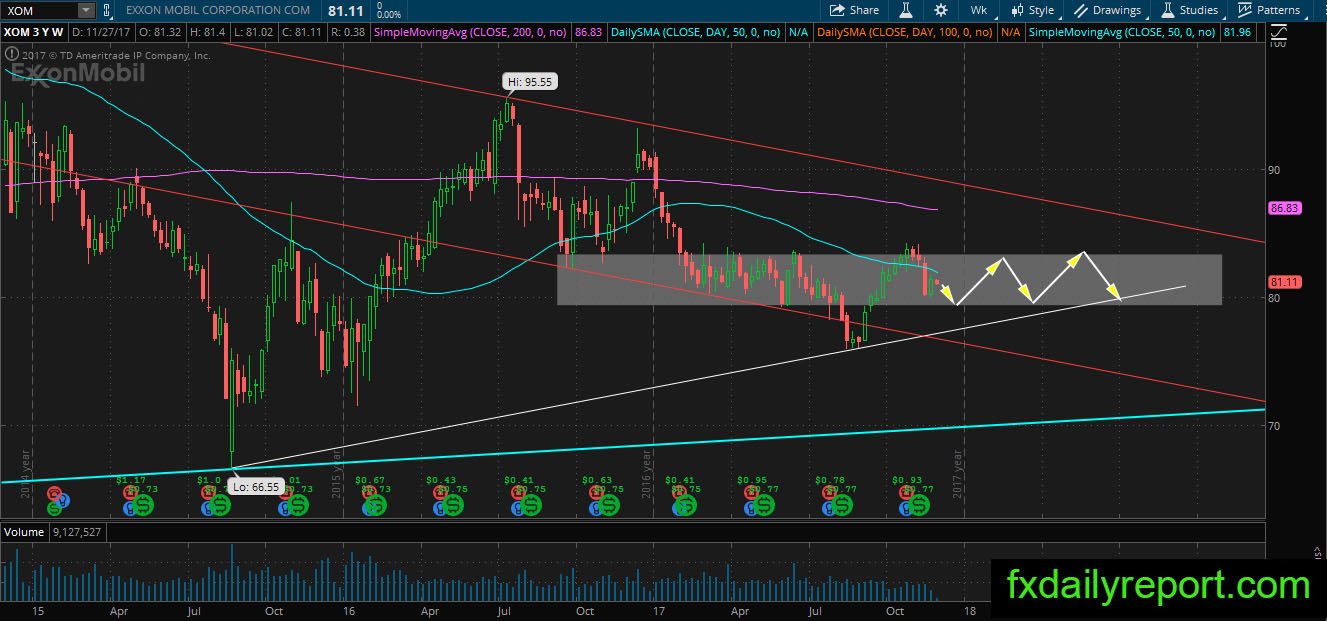
XOM movement limited inside the rectangle on the weekly chart. The share prices also stay below its SMA 50 which is bearish. Traders could look for long position near the bottom of the rectangle or near the white trendline. Short position from weekly SMA 200 also a choice trade could consider.
Daily chart

The outlook on the daily chart slowly turns positive after the share prices claimed position above the daily SMA 200. Currently, the share prices traded between SMA 50, 100 & 200 which suggest consolidation under progress. A break away from averages higher will lead XOM to challenge resistance around $83.50.
Trade plan
The bullish trade could be taken near the daily SMA 200.
The bearish trade might need to wait until the share prices reach the top of rectangle consolidation.