
XOM Long-term outlook
September is the month of tension and also the month where hurricane strike U.S and neighboring country. The tension caused by North Korea missile threat put the market in risk aversion mode. However, the one which influences crude oil and commodity prices is the hurricane strike. Under attack by Hurricane Harvey, Irma, and Maria; crude oil rallied above $50.00.
XOM share prices also gained from $76.32 to $81.98, up $5.66 or 7.4% for the month. THe gain mostly attributed to the advance in crude oil prices. However, the advance might see an obstacle as market normalizes after the hurricane attack in October.

Click here to see XOM September analysis
New Month
Monthly chart
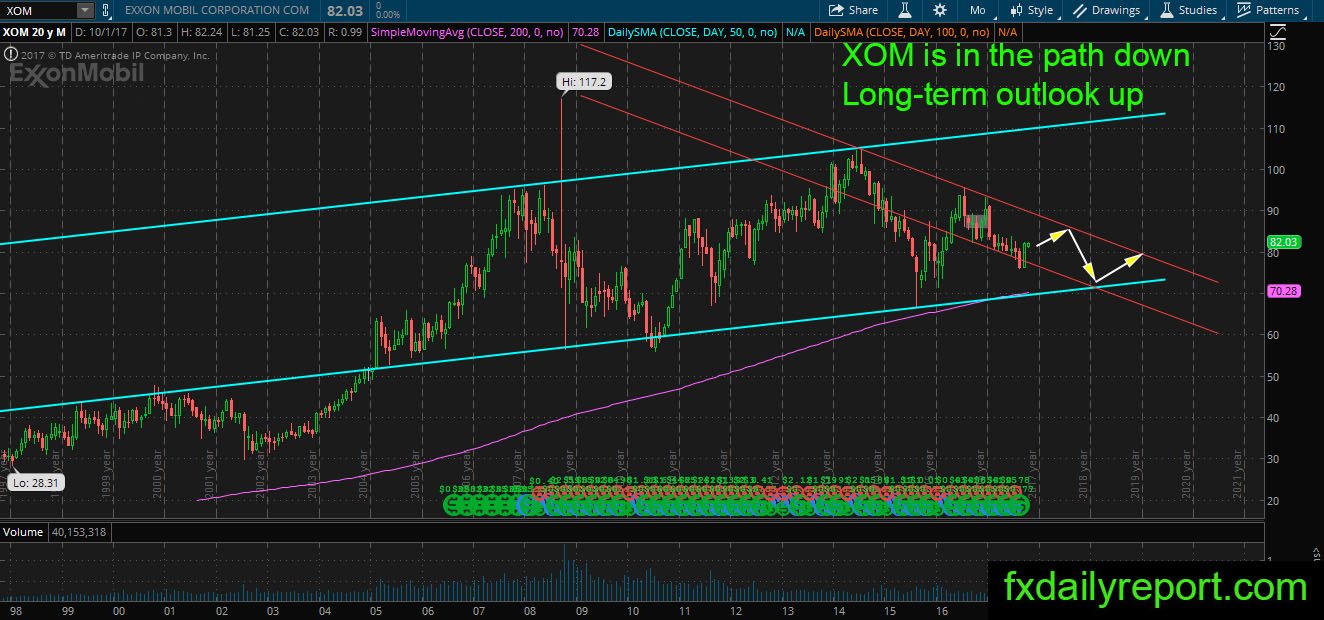
XOM on the monthly chart is moving in the bearish channel, and looks will continue downward. There is the bounce in the previous month which has not followed up by the bull yet. This month price stays inside previous month range and indicates no direction yet. The bounce in September will have confirmation after the move above the September candlestick high.
Weekly chart
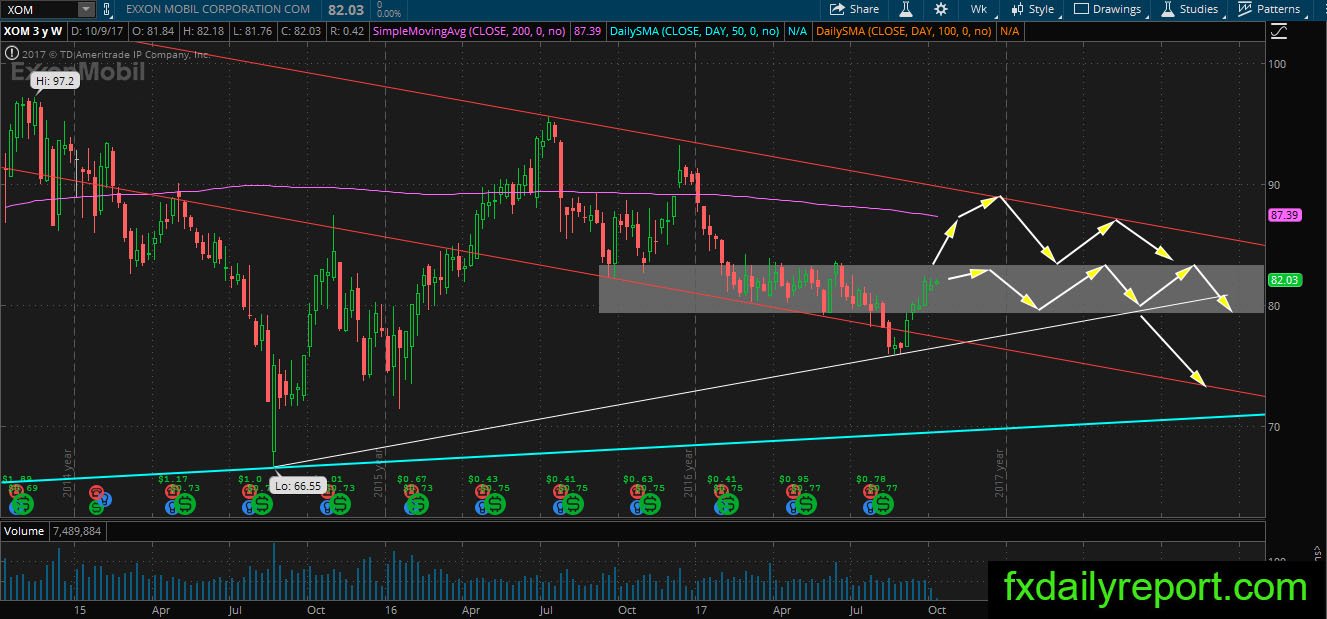
XOM boosted after the bounce from the bottom of the channel. The price expected to hit the resistance around $83.00 – $83.50 where it consolidated before the previous drop. The break above the resistance will bring the price toward weekly SMA 200 and top of the channel. Traders could look for short position when the price hit both resistance.
Daily chart
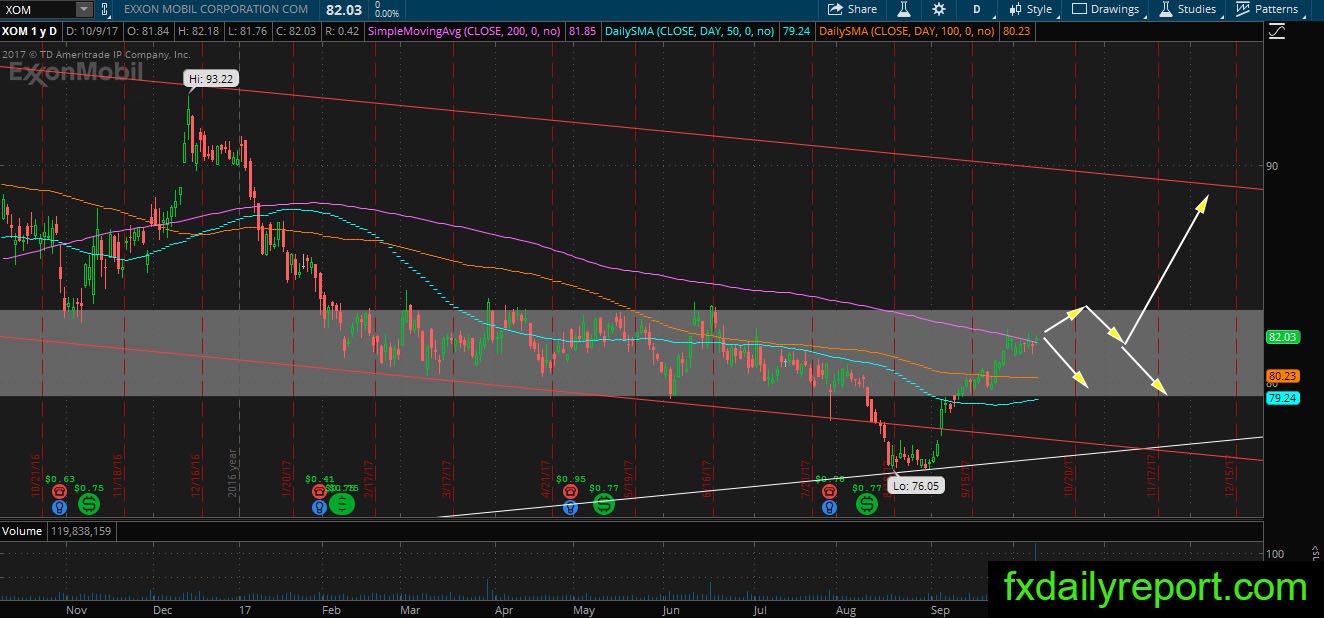
The daily chart outlook show there is no more room upside for XOM. The price is testing daily SMA 200 and near the top of consolidation area shown on the weekly chart. The odds favor reversal lower, but there is a possibility the share prices will continue upward to fulfill the bearish channel trade.
Trade plan
The bullish trade might need to wait until the share prices closed above daily SMA 200 and made a successful retest above it.
The bearish trade could be taken from daily SMA 200 or wait for a better price at the top of the bearish channel.