
USDX (USD Index)

U.S dollar index in the previous day bounced from 100 handles and closed as sideway candlestick pattern “Harami.” The pattern has 100 as low and suggests possible downside breakout if the price slide down today. Europe is returning from long holiday and activities expected from the Euro region today. Traders must keep an eye on whether 100 or 100.64 broken first.
News to watch

08.30 AM U.S Building Permits expected 1.25 million permits issued
For full outlook for this week, you can follow Forex Outlook For The Week 17 – 21 April 2017
Technical Analysis
EUR/USD
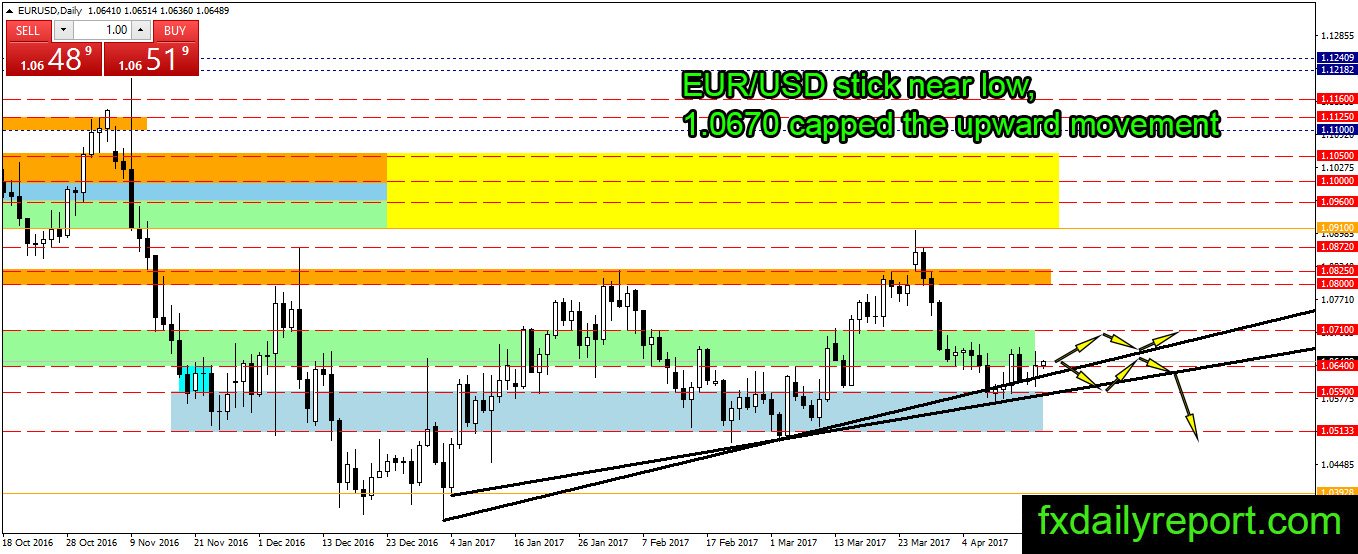
Not much change in the pair as it stick near the low, but previous day show hope for the bull as the price bounced from 1.0600. Asian session followed through by holding the pair above 1.06400. EUR/USD direction might be settled once European session open today.
Today critical level to watch:
Support: 1.0640, 1.0590, 1.0562, 1.0513
Resistance: 1.0710, 1.0800
GBP/USD
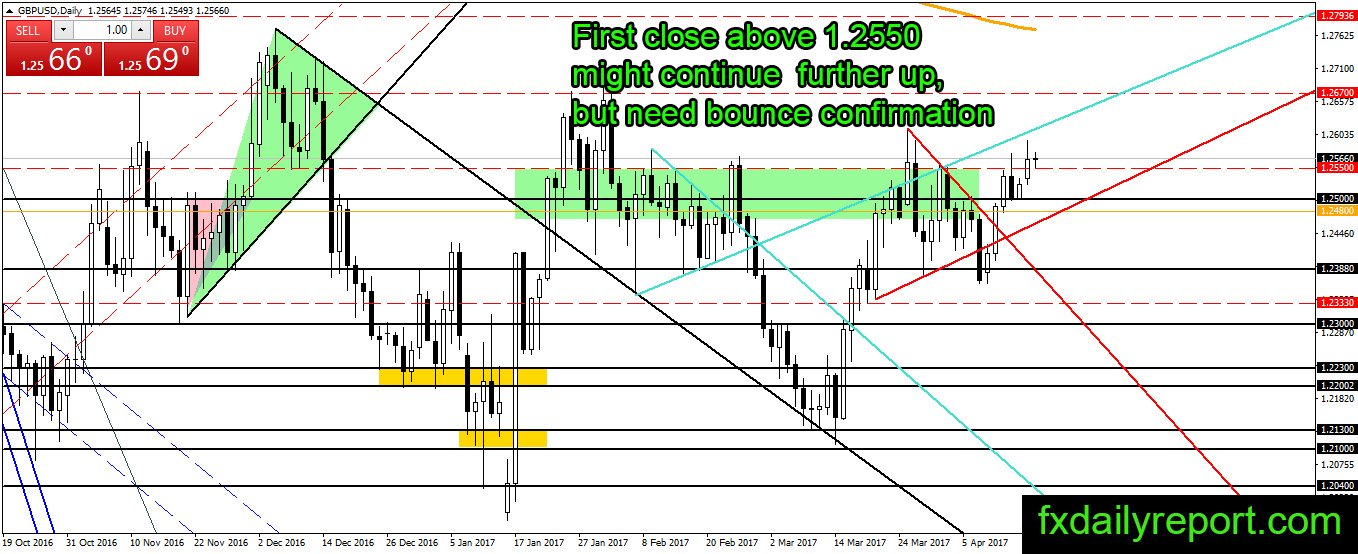
GBP/USD made first close above 1.2550 since last month. The pair continues to make pressure upside and looks ready to print new high. The bull needs to hold 1.2550 this week to ensure the continuation of the bullish trend in GBP/USD.
Today critical level to watch:
Support: 1.2550, 1.2500, 1.2480, 1.2388
Resistance: 1.2615, 1.2670
USD/JPY

The trial for USD/JPY bull continues even though the pair make a bullish pattern after it touches the bottom of the channel. The pair manages to move above previous day high but losing steam and move back near opening price. It is better for the bull to hold the price above opening price. Otherwise, the bear will return and push the price further down.
Today critical level to watch:
Support: 108.00, 107.41, 107.00
Resistance: 109.00, 110.00, 110.50, 111.00
AUD/USD
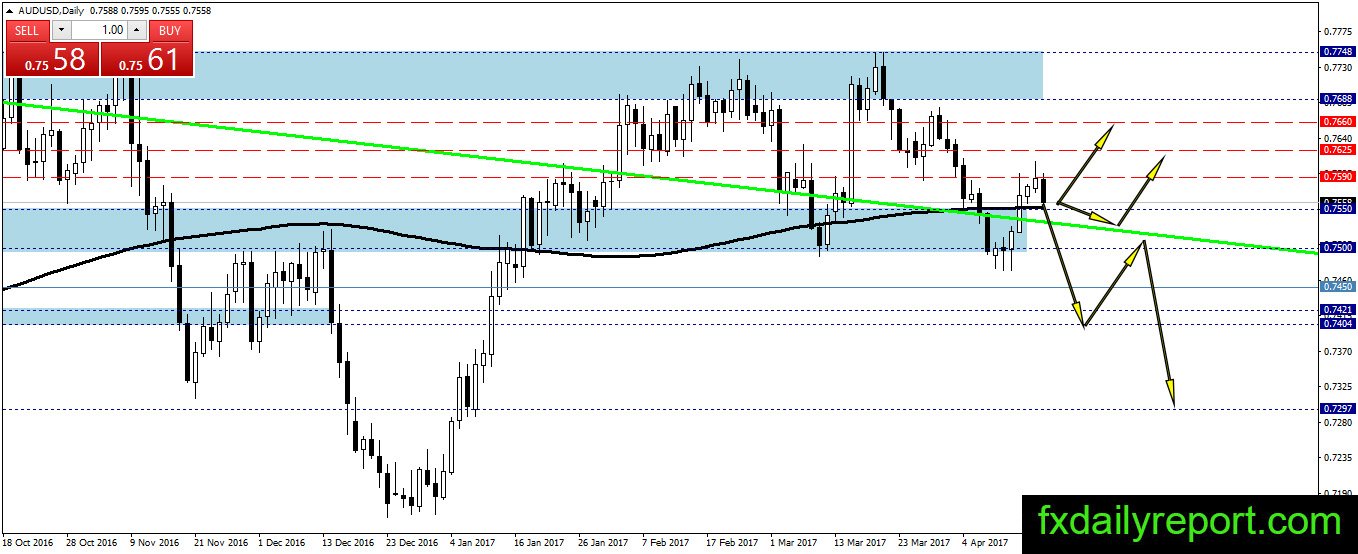
AUD/USD closed above daily SMA 200 and currently testing it. The pair slides down and looking for support. Traders might be able to place long position near the daily SMA 200, but it is suggested to wait until the close of daily candlestick before placing any position.
Today critical level to watch:
Support: 0.7550, 0.7500, 0.7450, 0.7421
Resistance: 0.7590, 0.7625, 0.7660