
USDX (USD Index)
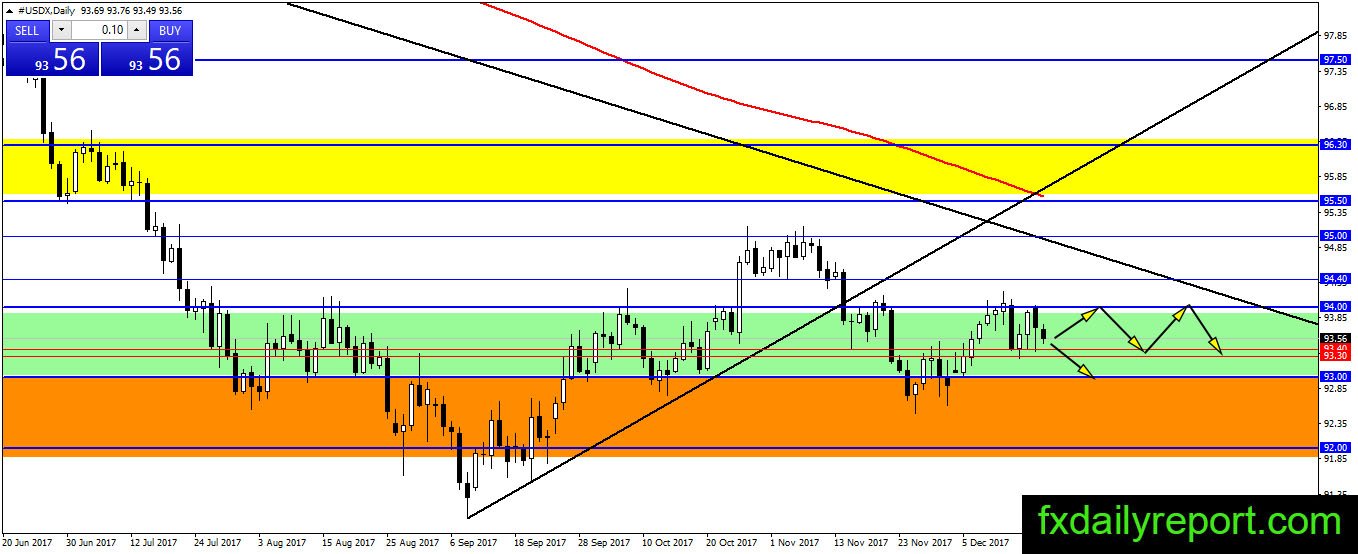
The index completed upward movement and tested 94.00 resistance. No change to the current outlook as the index rejected from top of the range. It is now expected to drift between 93.30 – 94.00 and looking for a breakout. Traders could continue trade the range.
News to watch

For full outlook for this week, you can follow Forex Outlook For The Week 18 – 22 Dec 2017
Technical Analysis
EUR/USD

There is possible flag pattern on the EUR/USD daily chart which is a bullish pattern. If the bull could make a breakout and confirm the pattern, the pair could move toward 1.2000. Otherwise, a break below 1.1710 is undesirable and could plunge EUR/USD down toward 1.1500.
Today critical level to watch:
Support: 1.1710, 1.1650
Resistance: 1.1820, 1.1850, 1.1925, 1.2000
GBP/USD
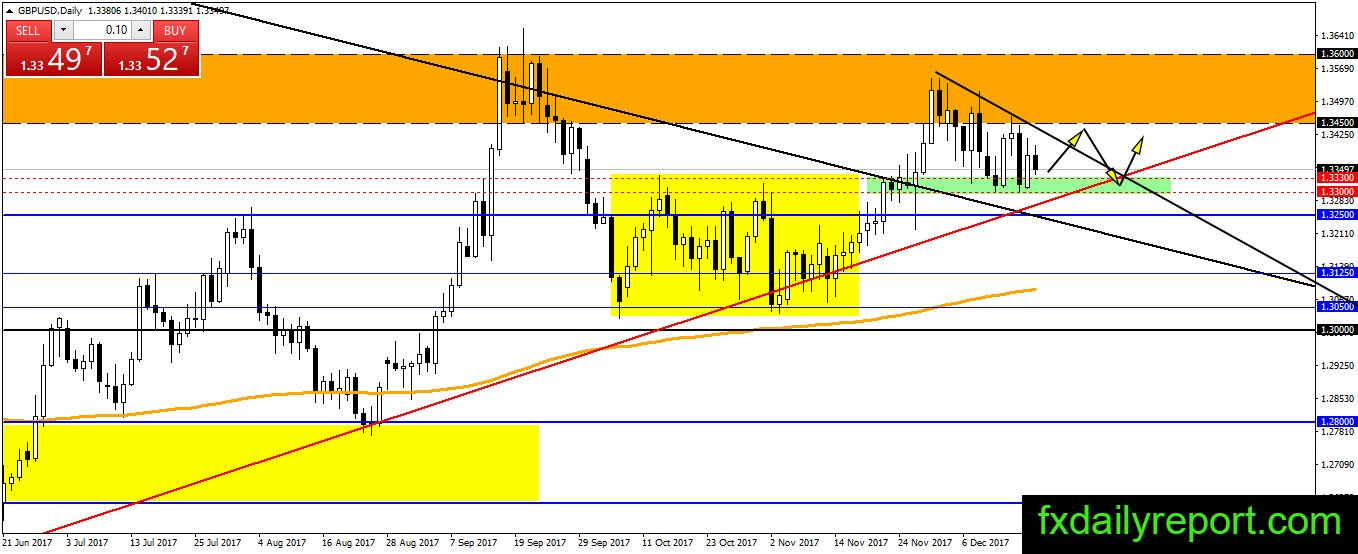
GBP/USD supported at 1.3300 – 1.3330 after several tests to the support area. However, the bounce produces lower high which is alarming. Most of the time, the price will break to the level which is tested more, in this case, 1.3300 – 1.3330. A short position could be placed when the pair test top trendline. A long position could be taken from the 1.3300 – 1.3330 as long as it holds.
Today critical level to watch:
Support: 1.3342, 1.3300, 1.3250
Resistance: 1.3400, 1.3450, 1.3500
USD/JPY
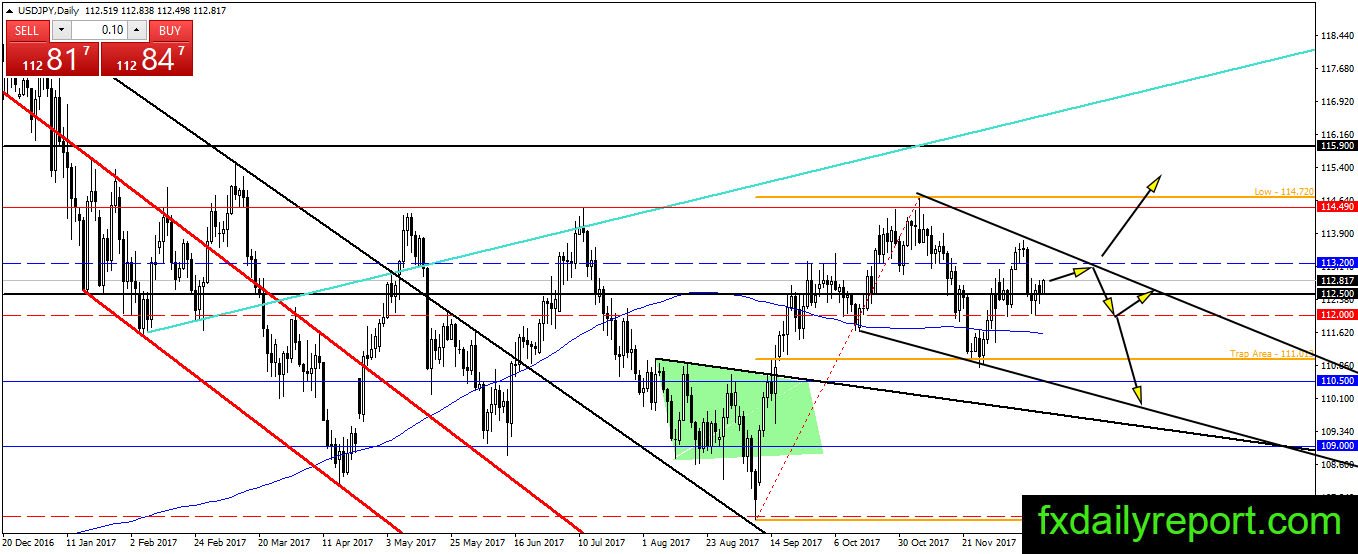
There are bearish indications on USD/JPY daily chart, but the bear still not able to push the pair lower. A lower low initially printed below daily SMA 200, followed by a lower high around 113.70. The bear only needs to push the price below daily SMA 200 to drive the bull away.
Currently, USD/JPY supported by 112.50 support and it is better to short near 113.20.
Today critical level to watch:
Support: 112.50, 112.00, 111.60
Resistance: 113.20, 114.50
AUD/USD
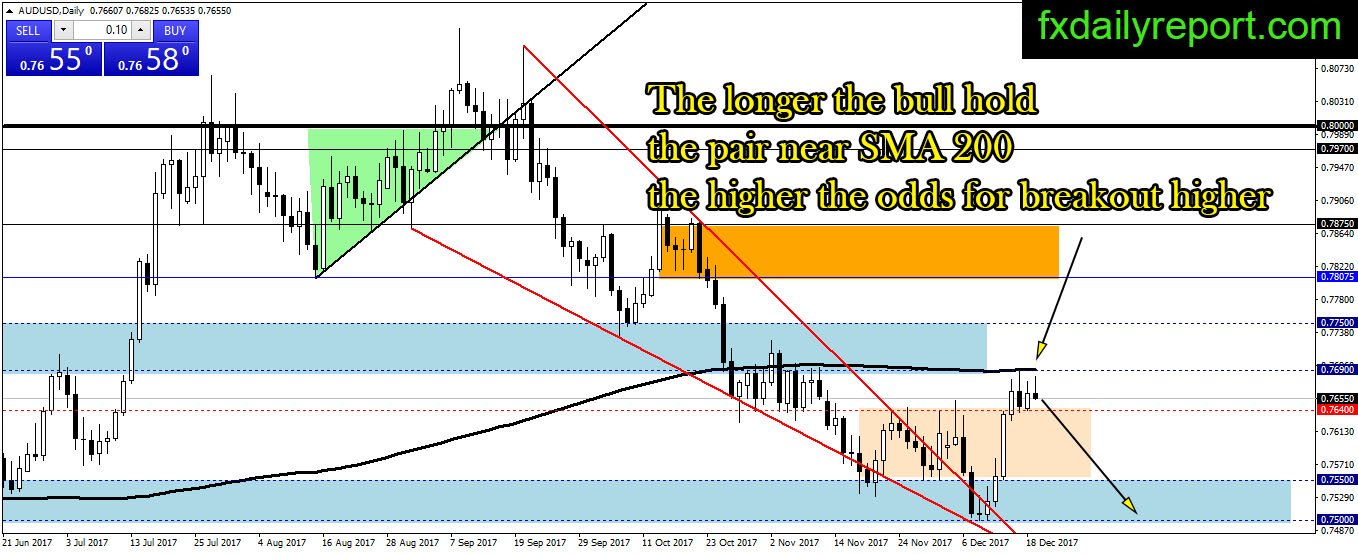
The situation on AUD/USD daily chart followed text-book as the pair stuck below the averages. However, the longer the pair stay near the resistance, the weaker the level. If AUD/USD follows the text-book trade, it will close below 0.7640 and resume the downtrend. Otherwise, a break and close above daily SMA 200 will cancel the bearish outlook.
Today critical level to watch:
Support: 0.7630, 0.7550, 0.7500
Resistance: 0.7690, 0.7750