
USDX (USD Index)
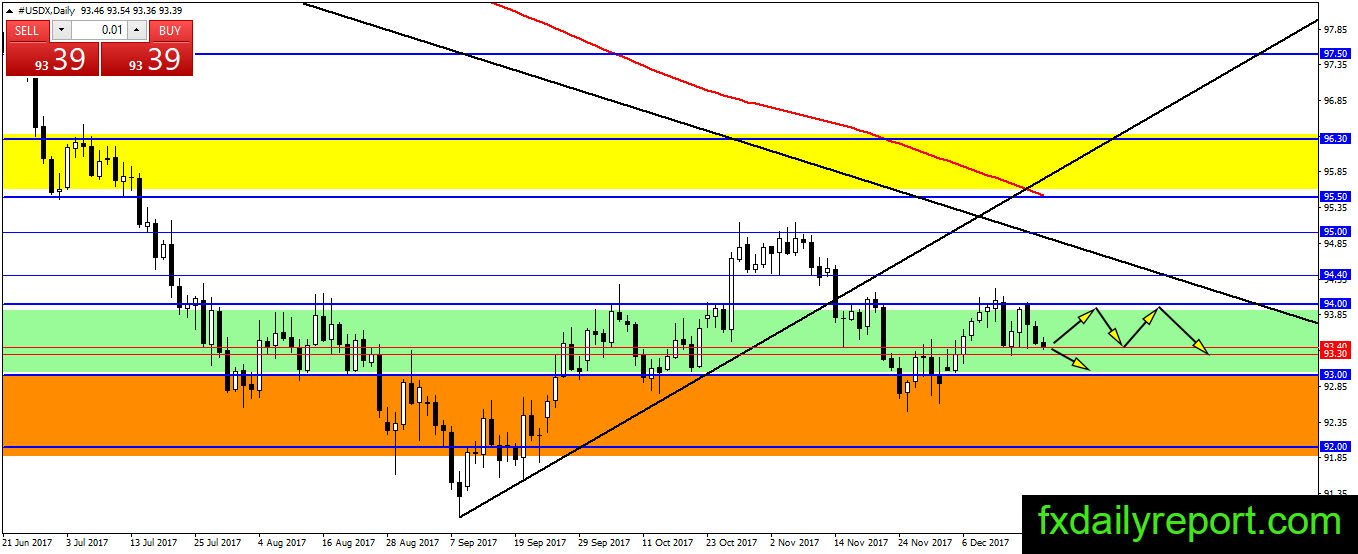
U.S dollar index rejected from 94.00 resistance and head lower to 93.30 – 93.40 area. The index found support and hold against the bear in this area. However, it looks like the bear still looking for momentum to bring the index down to 93.00. Traders will take a look at the index close today to determine if the downward movement will reach 93.00.

Meanwhile, from fundamental side, tax-bill has passed from the senate and return to the house for the final vote. Wednesday trading session should provide some volatility as the vote ongoing.
News to watch
10.30 AM U.S Crude Oil Inventories, estimated a deficit of 3.6 million barrels.
For full outlook for this week, you can follow Forex Outlook For The Week 18 – 22 Dec 2017
Technical Analysis
EUR/USD
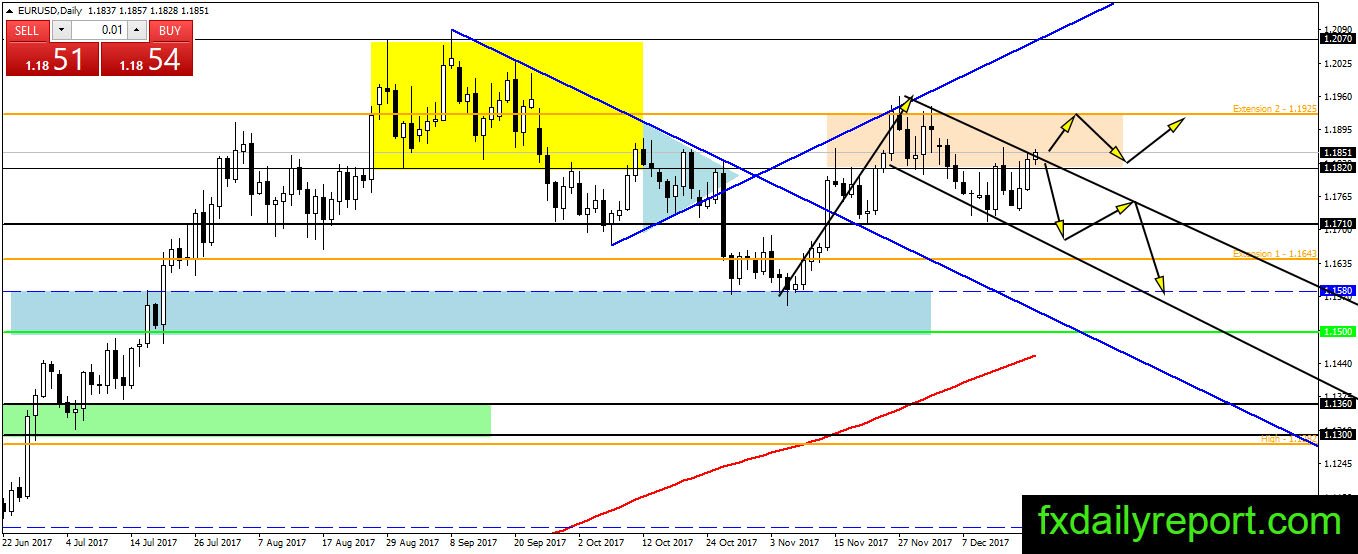
The pair is at a crucial moment, and looks have broken upside on the daily chart. EUR/USD broke the bullish flag pattern, but showing no upside momentum yet. It is important for the bull to widen the advantage above the trendline. Otherwise, a counter selling will happen and bring the pair down to test 1.1710.
Today critical level to watch:
Support: 1.1820, 1.1710, 1.1650
Resistance: 1.1850, 1.1925, 1.2000
GBP/USD
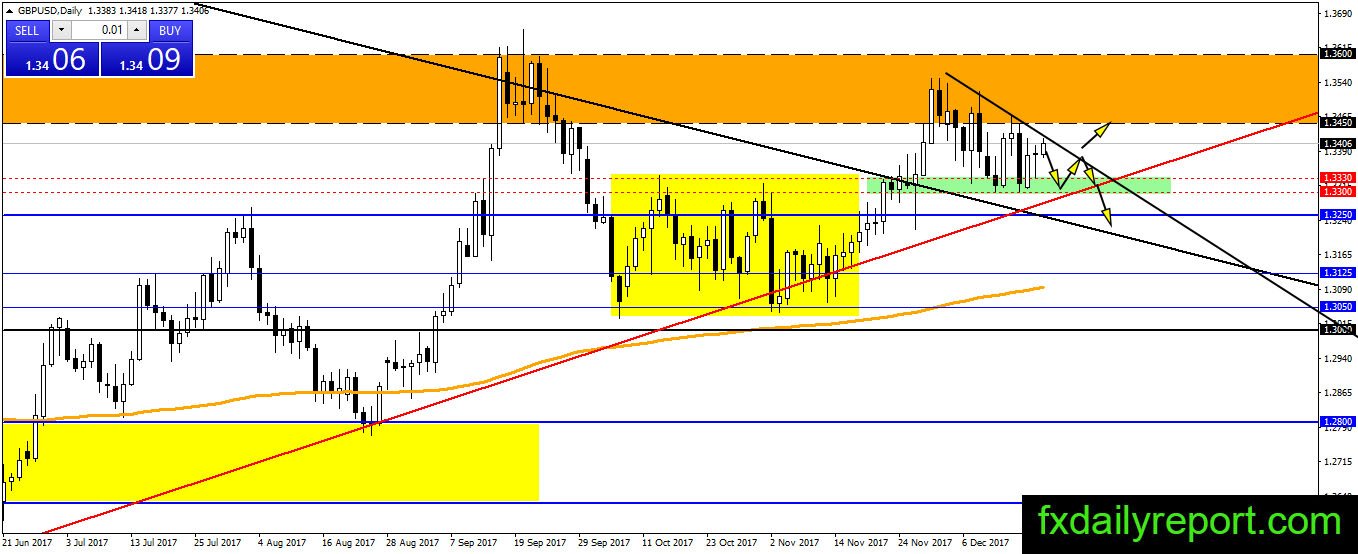
There is no change to the GBP/USD outlook. The pair is looking for direction and testing both down trendline and 1.3300 – 1.3330 support area. A breakout could happen either way and traders might want to wait until breakout happen.
Today critical level to watch:
Support: 1.3342, 1.3300, 1.3250
Resistance: 1.3400, 1.3450, 1.3500
USD/JPY
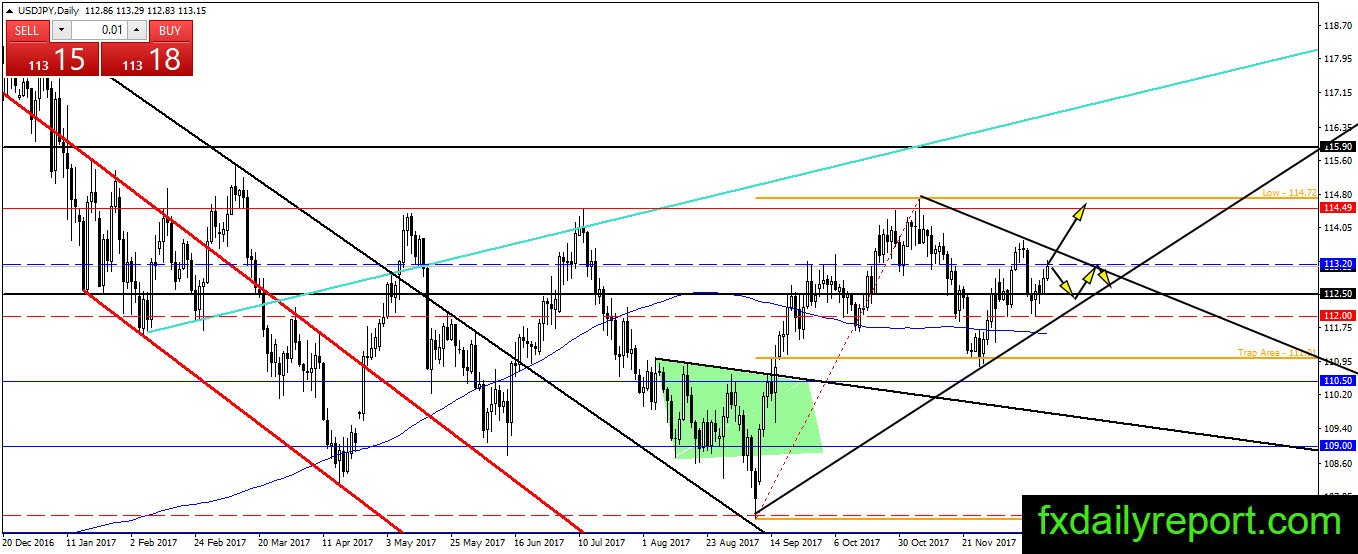
Looking for short is idea traders could adopt at the current time as USD/JPY testing 113.20 resistance. The level has proven itself as the strong level which holds the bull or the bear from advancing further. If USD/JPY reverse its direction and start falling from the resistance, it will produce lower high and target lower low below 111.00.
Today critical level to watch:
Support: 112.50, 112.00, 111.60
Resistance: 113.20, 114.50
AUD/USD
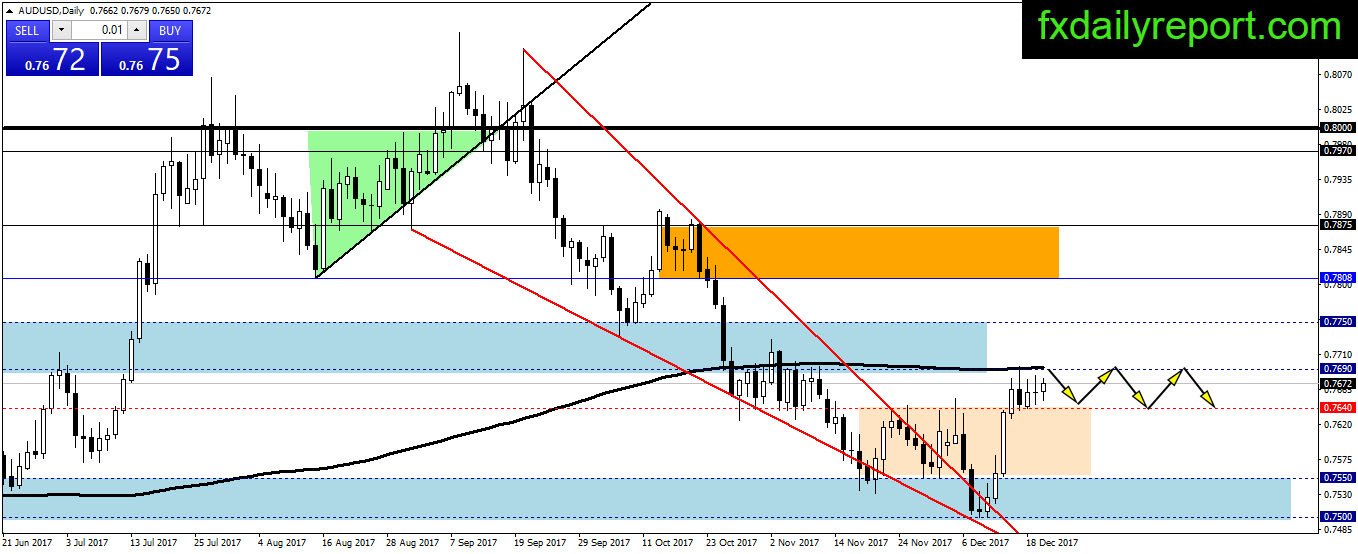
Consolidation and more consolidation happen on AUD/USD chart. The pair has completed its correction and currently trading between daily SMA 200 and 0.7640. No breakout and hint for next direction yet. Traders could wait until momentum movement produced before entering a position.
Today critical level to watch:
Support: 0.7630, 0.7550, 0.7500
Resistance: 0.7690, 0.7750