
USDX (USD Index)
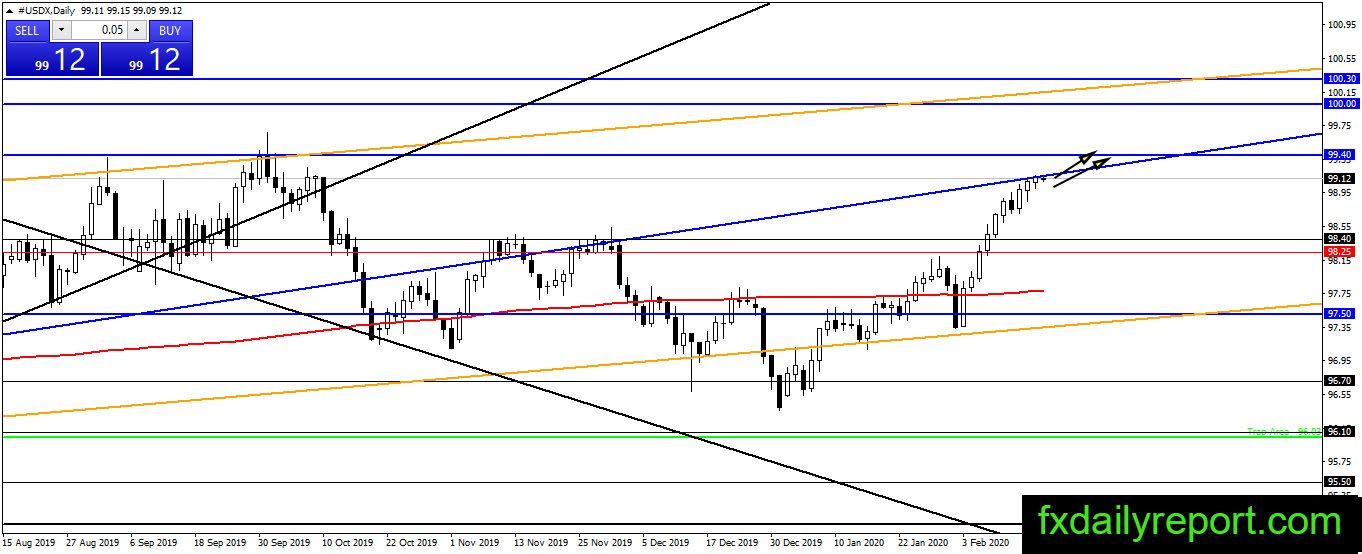
There is no change to the latest analysis of the U.S dollar index. The index expected to reach 99.40 – 100.00 resistance and test it. The next long-term direction is bullish as long as the index stays above 98.25 – 98.40. A close above 99.40 and 100.00 is a strong confirmation of the long-term bullish trend.
News to watch

For full outlook for this week, you can follow Forex Outlook For The Week 17 – 21 February 2020
EUR/USD
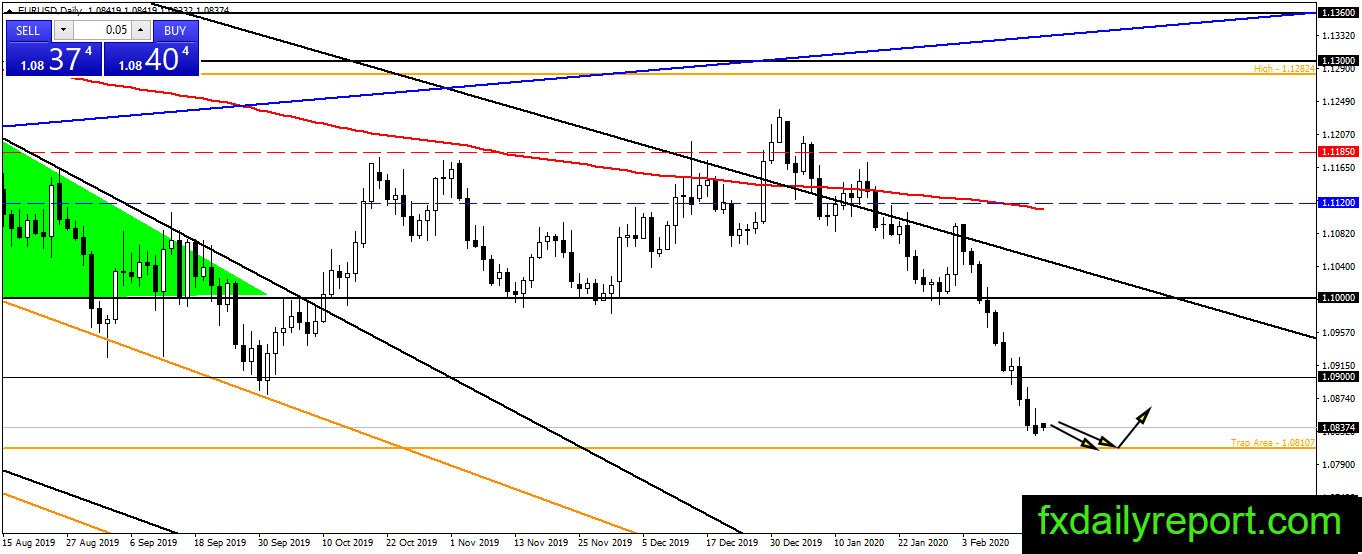
EUR/USD on track lower and ready to reach the 1.0800 level. Traders should avoid long positions until a major bullish pattern formed. If the pair turn higher then traders could watch 1.0900 as the level to take short positions. On a higher level, there is 1.1000.
today critical levels to watch:
Support: 1.0800
Resistance: 1.0900, 1.1000
GBP/USD
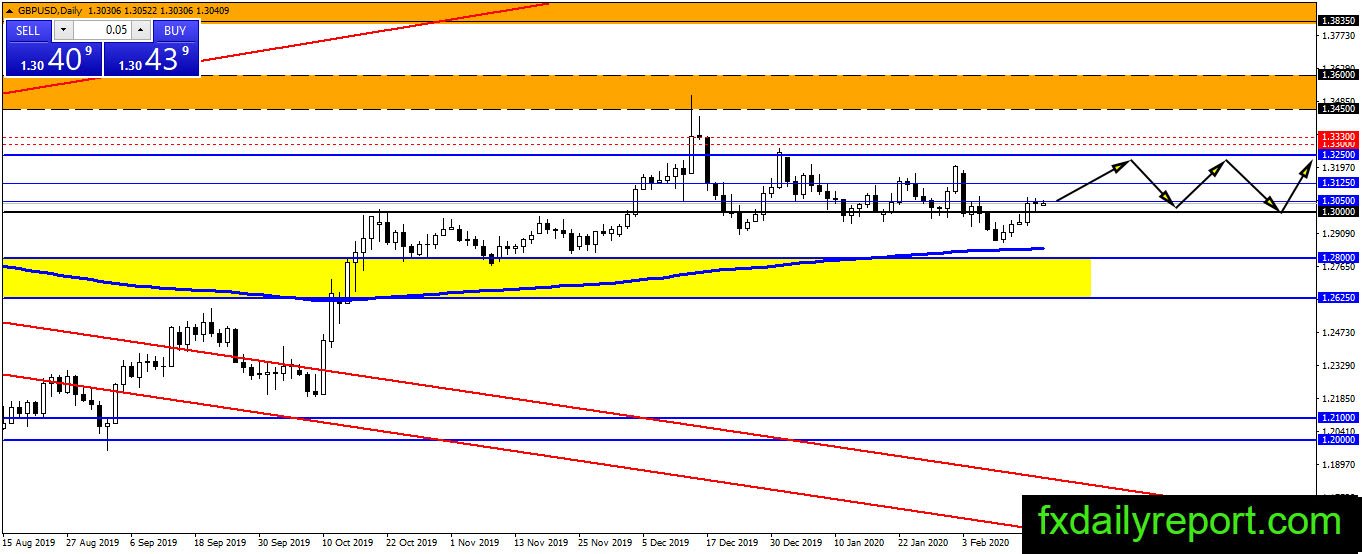
GBP/USD return inside 1.3000 – 1.3250 range and expected to move sideways inside the range. Traders could use 1.3000 as a level to take long positions. However, if a close below 1.30000 happens then traders might want to switch to the bearish side and target 1.2800, daily SMA 200.
Today Critical level to watch:
Support: 1.3000, 1.2800
Resistance: 1.3050, 1.3125, 1.3250
USD/JPY
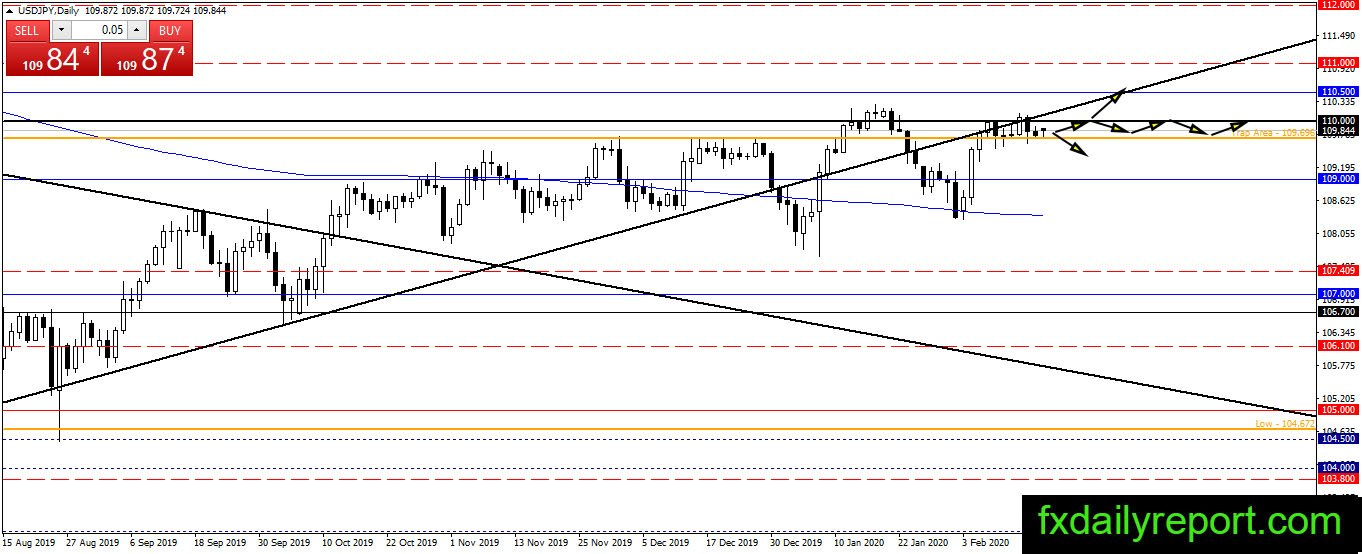
USD/JPY maintained the position inside 109.70 – 110.00 and provide traders with no breakout scenario. The pair might continue its ranging movement inside the 109.70 – 110.00 range again this week. As long as no breakout happens, traders will continue waiting for sideline with a bullish bias.
Today critical levels to watch:
Support: 109.70, 109.00, 108.50, 108.00
Resistance: 110.00, 110.50, 111.00
AUD/USD
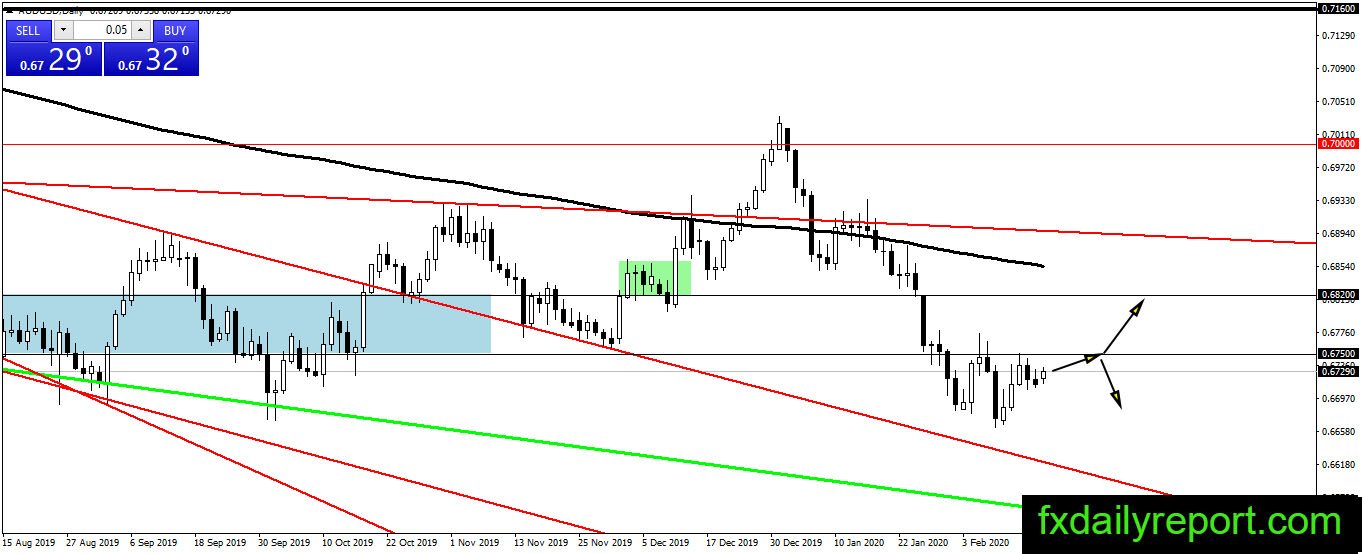
AUD/USD rejected from the 0.6750 and slightly lower last week. Today, the pair make an upward attempt and might retest 0.6750 again. If the retest resulted in a bearish reaction again then traders could enter short positions. However, if a bullish close happens above 0.6750 then traders might want to let the pair reach 0.6820.
A double bottom pattern may be on the making. A breakout above 0.6820 and SMA 200 is the pattern confirmation.
Today critical levels to watch:
Support: 0.6600
Resistance: 0.6750, 0.6800, 0.6820