
USDX (USD Index)
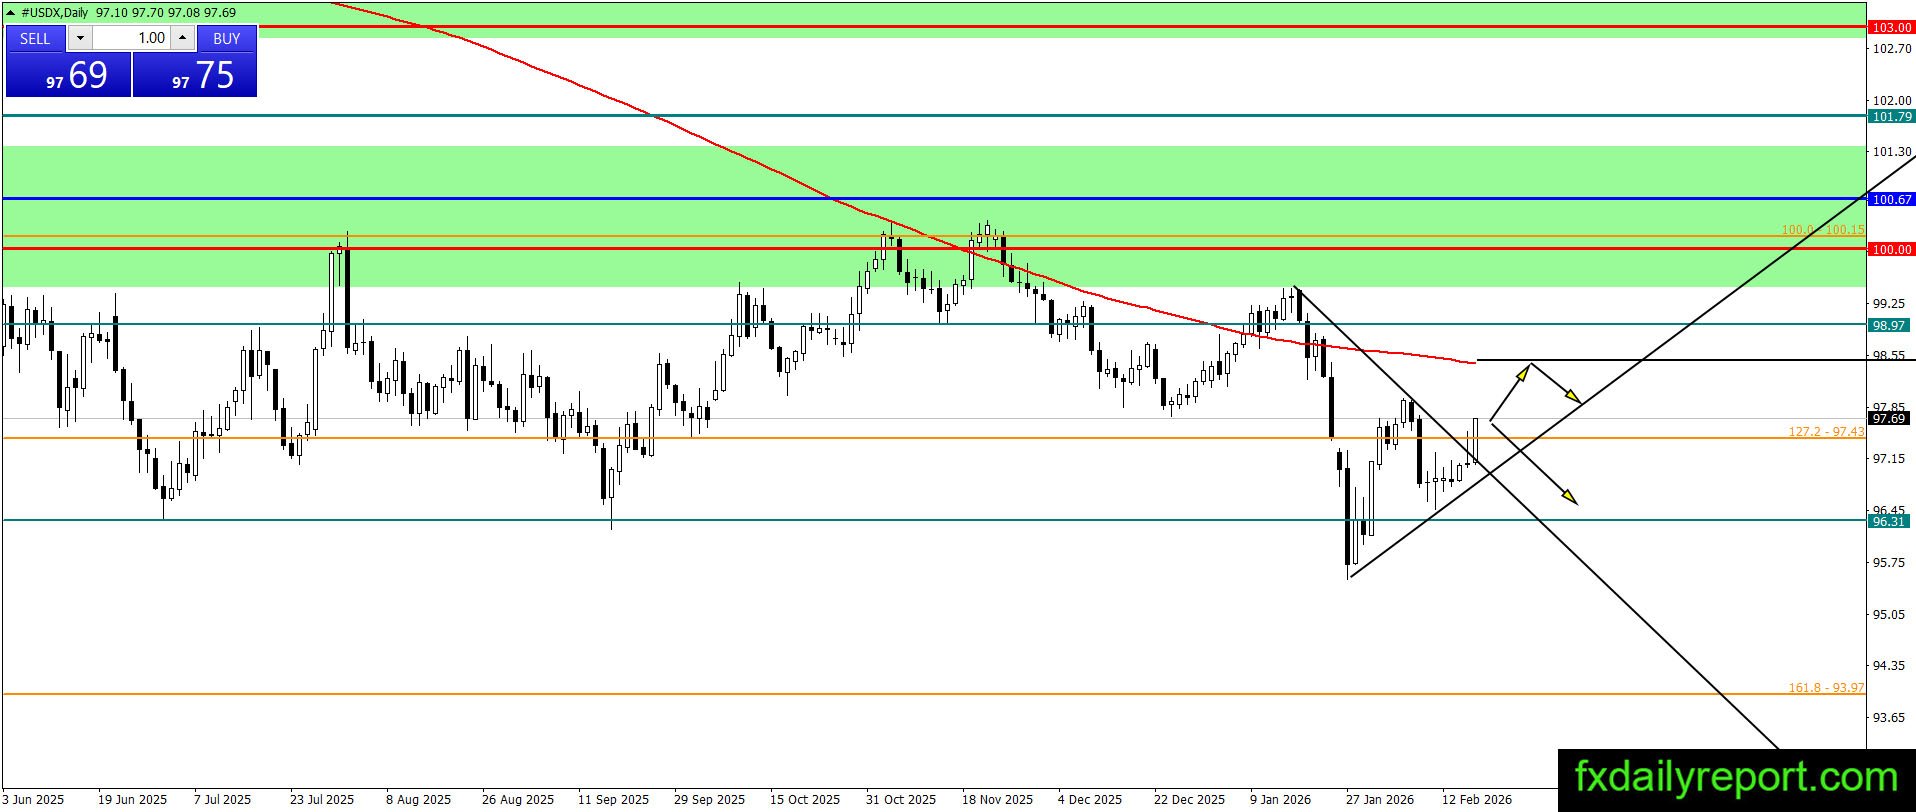
U.S dollar index flipped bullish as it breaks from the triangle pattern, but no new higher swing high yet. If the index continues higher and form a new higher swing high, then it will target the daily SMA 200. On the other hand, if the index immediately turns lower and form new lower swing low, then the bullish scenario invalidated.
EUR/USD

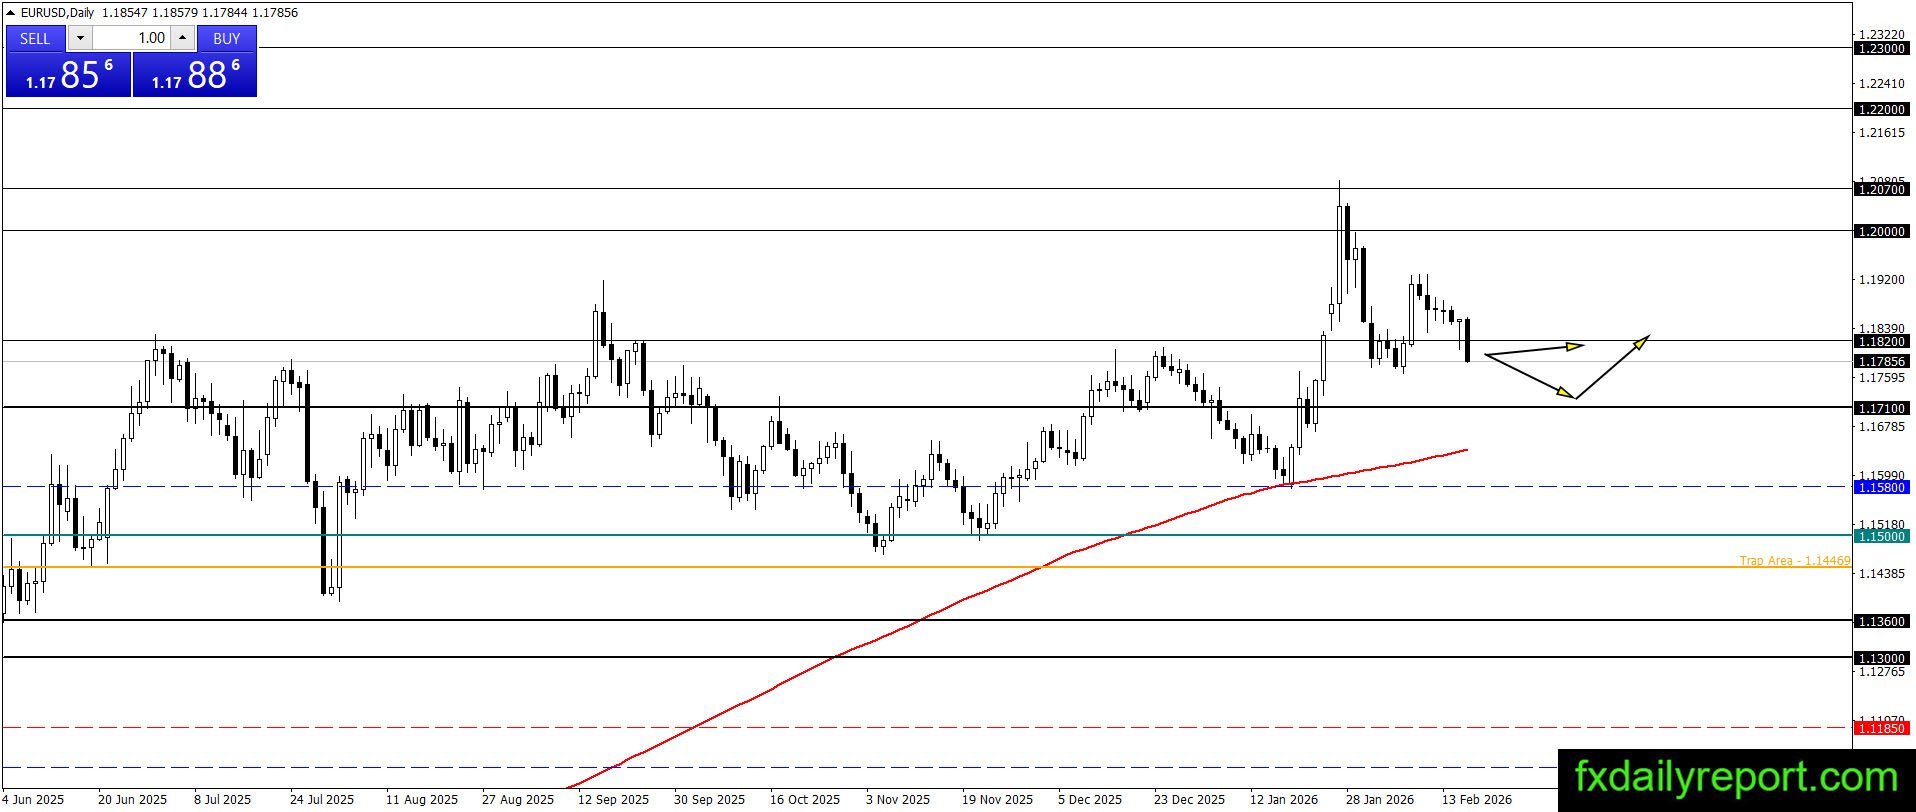
EUR/USD breakout below the 1.1820 level with strong momentum today. It looks like the pair will fail the bullish scenario and continue lower to target 1.1710. Right now, no lower swing low printed yet, which mean there is chance of bullish reversal. If the pair immediately climb and close above 1.1820 then the bullish structure maintained.
Today’s critical levels to watch:
Support: 1.1820, 1.1710, 1.1580, 1.1500, 1.1360, 1.1300
Resistance: 1.2000, 1.2070
GBP/USD
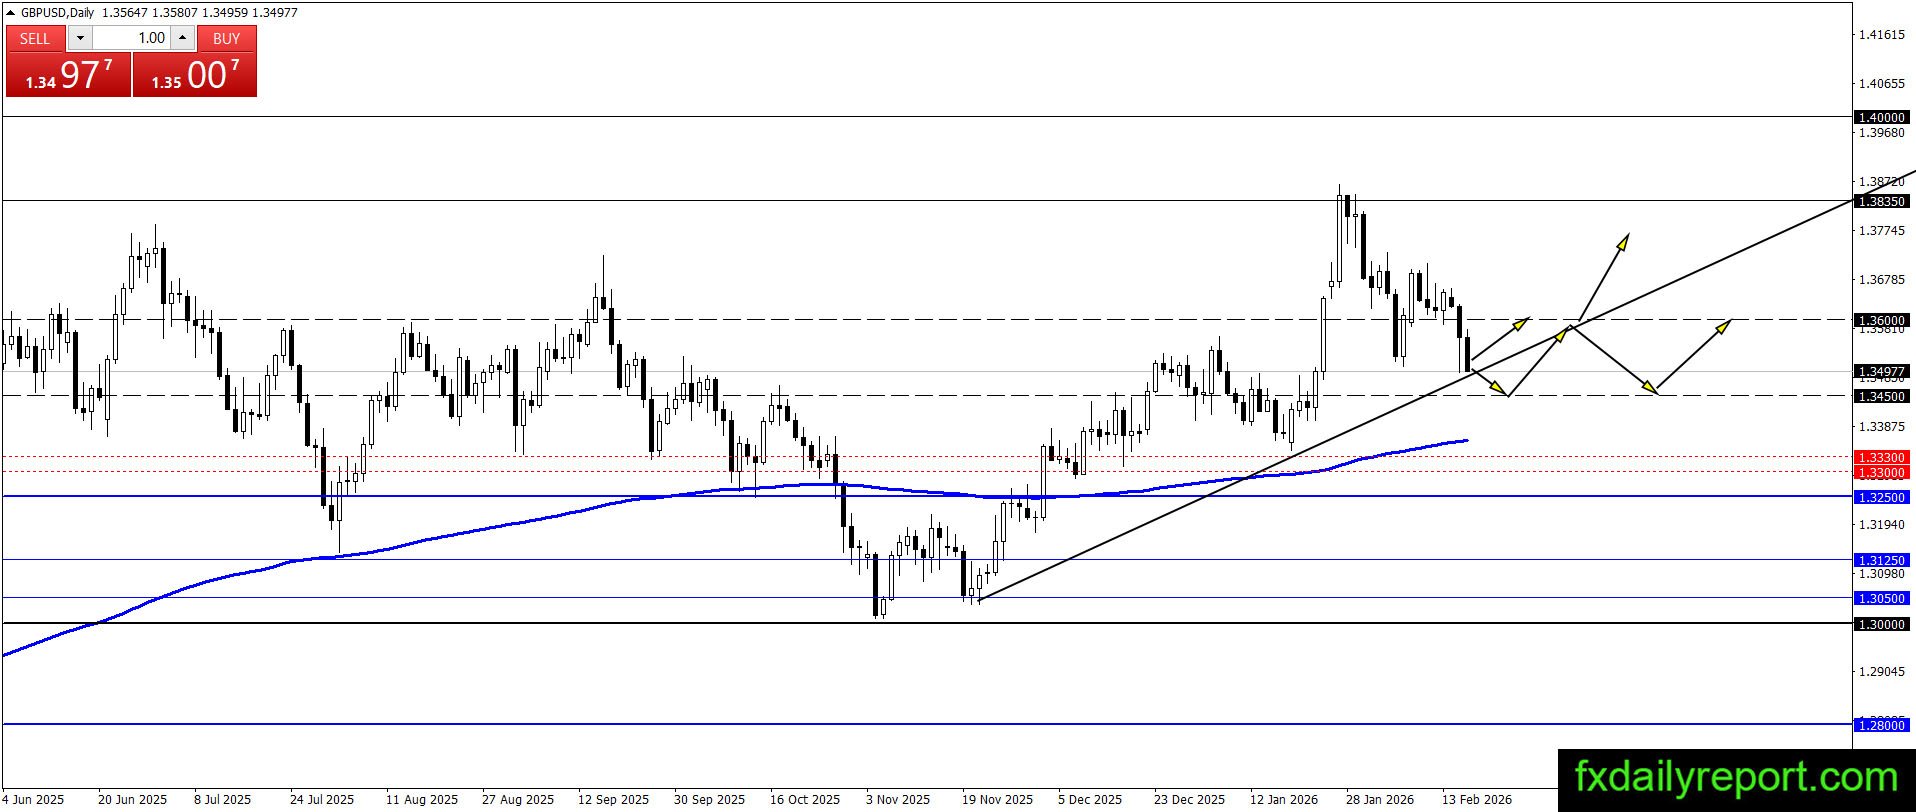
GBP/USD failed to maintain the position above 1.3600 level and now under bearish pressure. It might target the 1.3450 level if the trend line broken. As the bear is in control for now, traders better wait sideline and watch the reactions. If there is strong bullish reactions, then it is the confirmation to enter long positions. A new lower swing low or close below daily SMA 200 will become the confirmation that the trend has turned bearish.
Today’s critical levels to watch:
Support: 1.3450, 1.3330, 1.3300, 1.3250
Resistance: 1.3600, 1.3835, 1.40000
USD/JPY
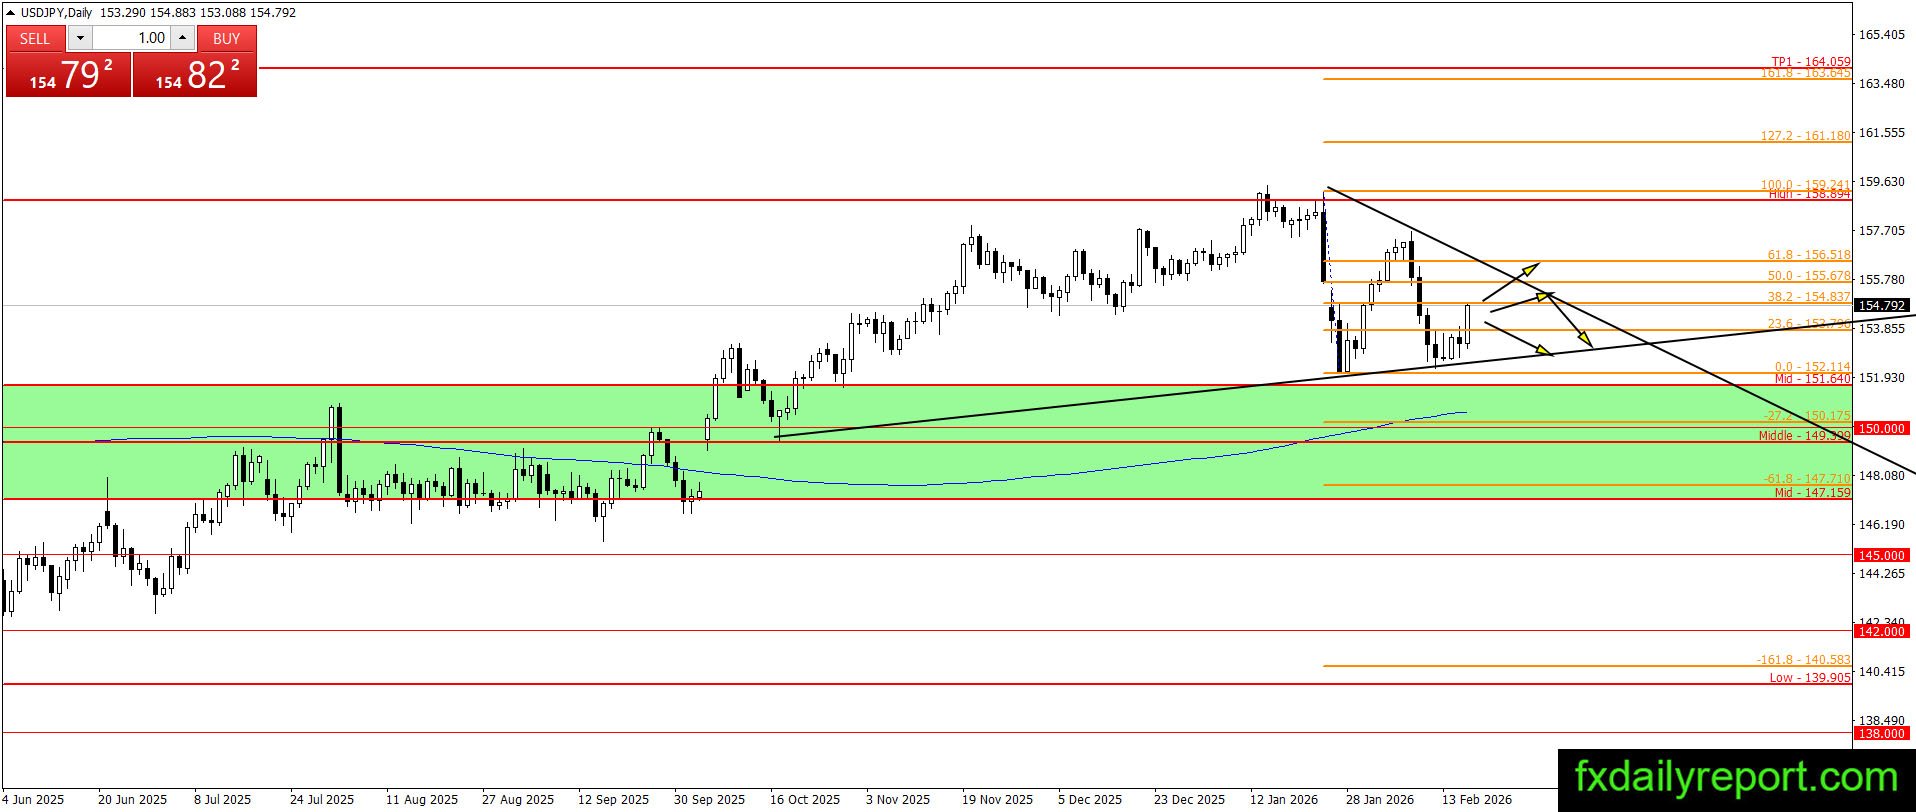
USD/JPY turned bullish just before it could reach the previous swing low. We now have a higher swing low, and the pair might move higher to form a lower swing high. It means a triangle formation is in play again. Traders will observe the pair movement for now. The next higher swing high or lower swing low will confirm the long-term direction.
Today’s critical levels to watch:
Support: 155.50, 155.00, 153.00, 151.00
Resistance: 158.89, 160.00
AUD/USD
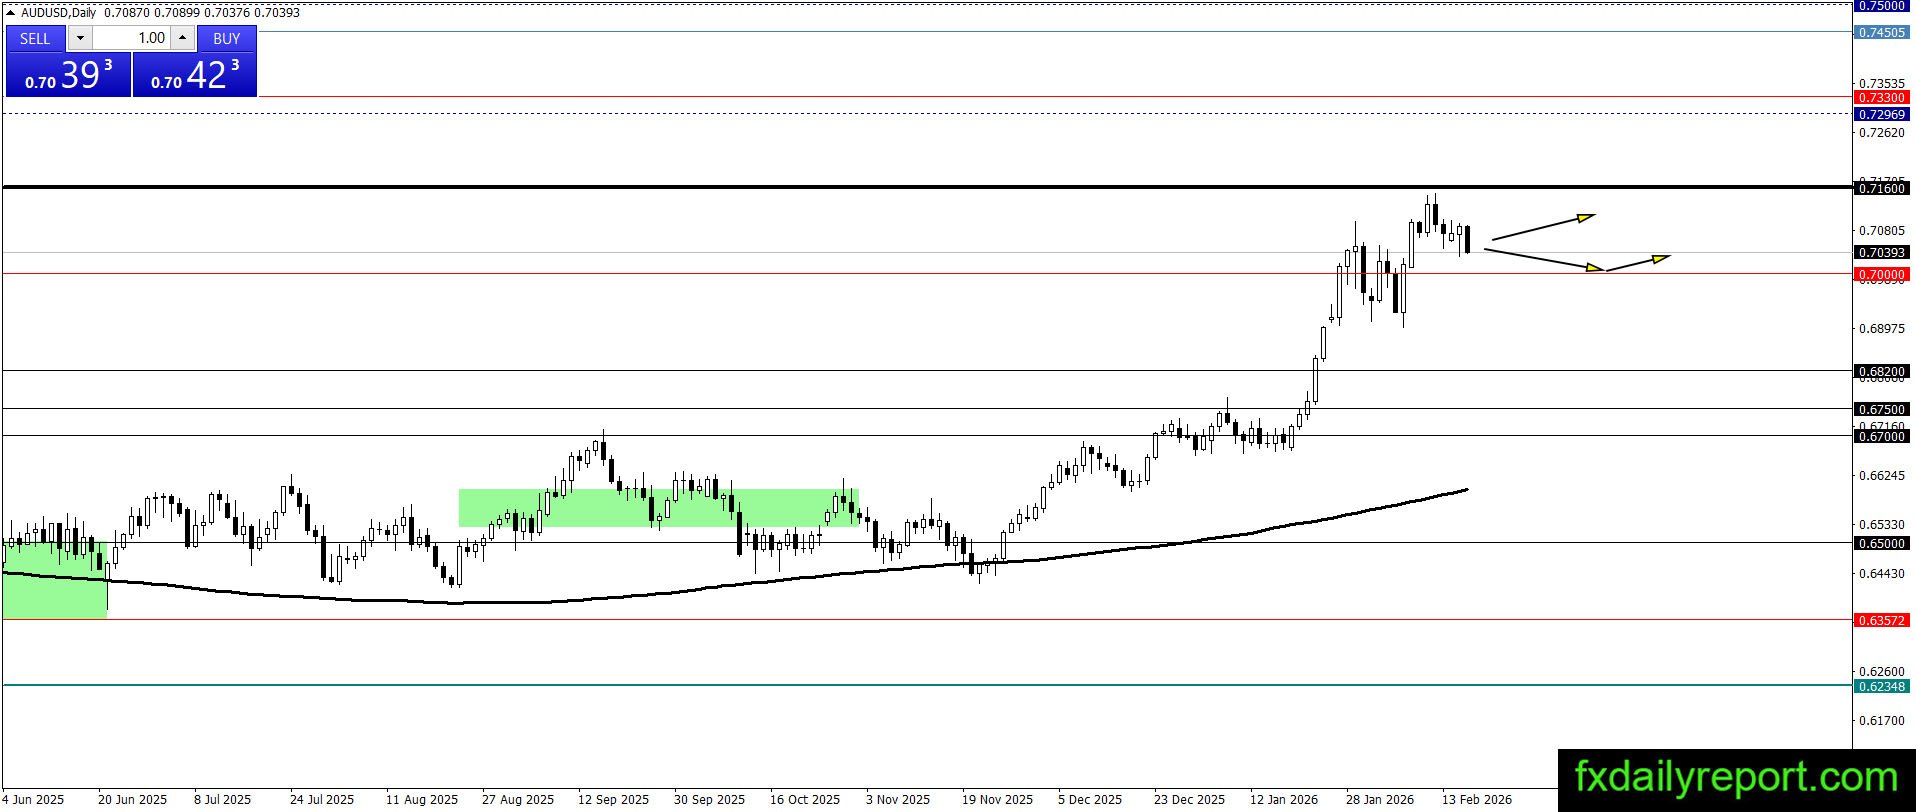
AUD/USD slightly lower after it reached the level near 0.7160. It might continue the downward movement to test the 0.7000 level. The long-term structure still bullish and the current bearish movement is a correction move. Traders will use the bearish correction as a chance to add long positions.
Today’s critical levels to watch:
Support: 0.7000, 0.6820, 0.6750, 0.6700, 0.6600
Resistance: 0.7160