
USDX (USD Index)
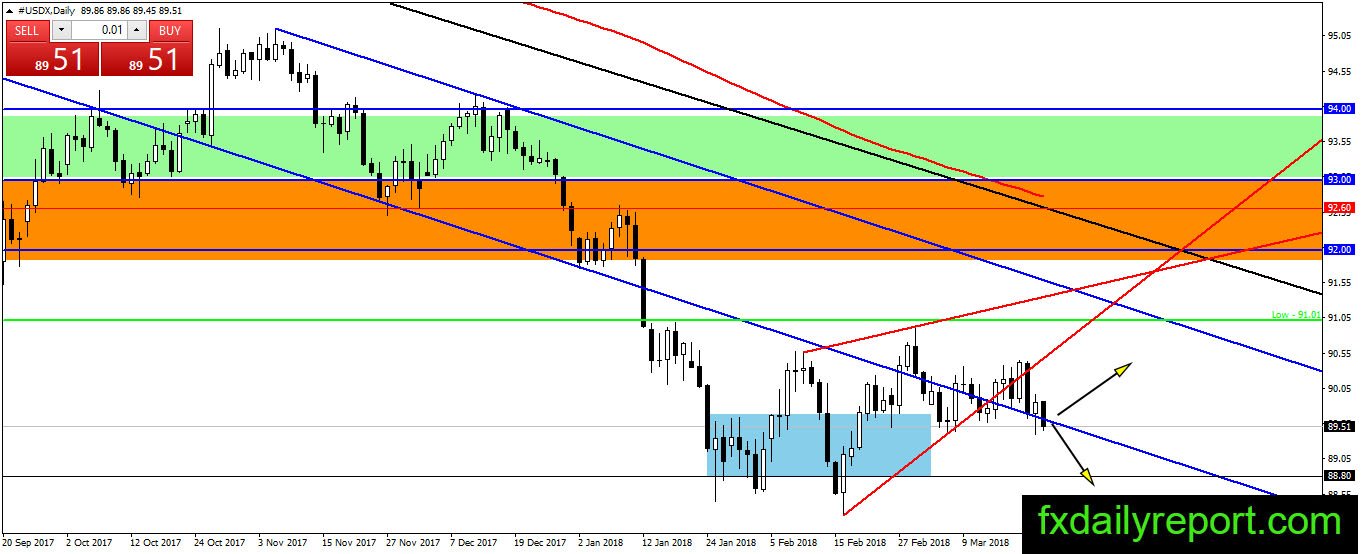
U.S dollar index on the path downward today even though the index closed as bullish candlestick above the bottom of the channel. It looks like the bear is winning the battle as The Fed stand on the dovish side. The closure of U.S dollar index near previous day low is the sign for more weakness next week.

The only news release to watch is U.S Core Durable Goods Orders which increase 1.2% M/M vs. 0.5% expectation.
News to watch
For full outlook for this week, you can follow Forex Outlook For The Week 19 – 23 Mar 2018
Technical Analysis
EUR/USD
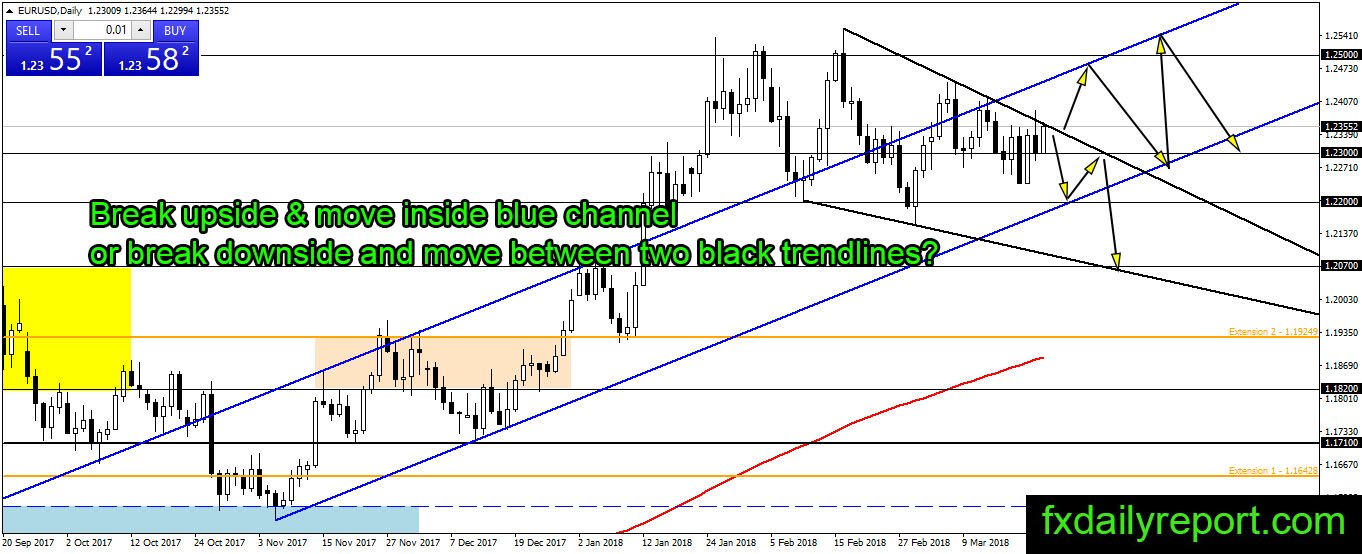
EUR/USD reclaim 1.2300 and move upward today. The bullish momentum still strong and currently testing the top black trendline. Will the pair break above the trendline and continue its bullish trend inside the blue channel? Alternatively, will it bounce down and break 1.2300 to continue traded between two black trendlines?
Today critical level to watch:
Support: 1.2300, 1.2200, 1.2100
Resistance: 1.2500
GBP/USD
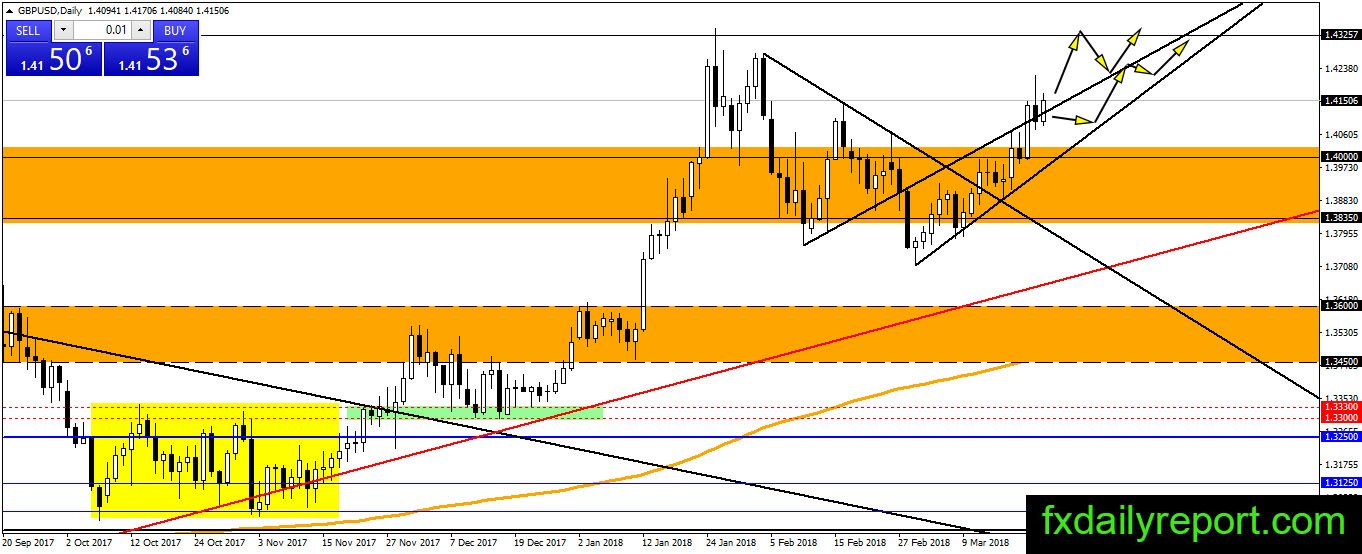
GBP/USD currently only have bullish scenario even though the pair closed down in the previous day. There is no bearish continuation confirmation today, and traders who have long position could continue to hold the position. Next week, we expect the pair is moving upward and reach 1.4300 or January high.
Today critical level to watch:
Support: 1.4000, 1.3850, 1.3835, 1.3800
Resistance: 1.4140
USD/JPY
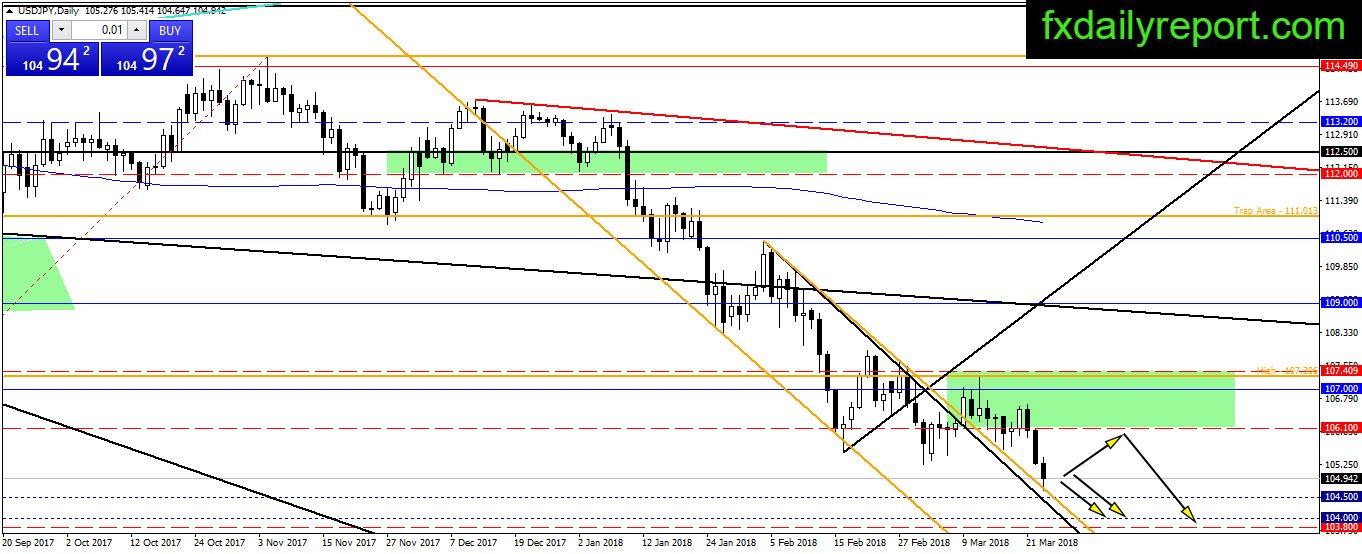
USD/JPY print fresh low and almost reach 104.50 support level. There is nothing to stop the bear yet, but the distance from support level might also become a consideration for a possible bounce. If USD/JPY bounced from the support, then traders could use 106.10 as resistance level to place short position.
Today critical level to watch:
Support: 105.00, 104.50
Resistance: 105.50, 106.10, 107.00, 107.40
AUD/USD
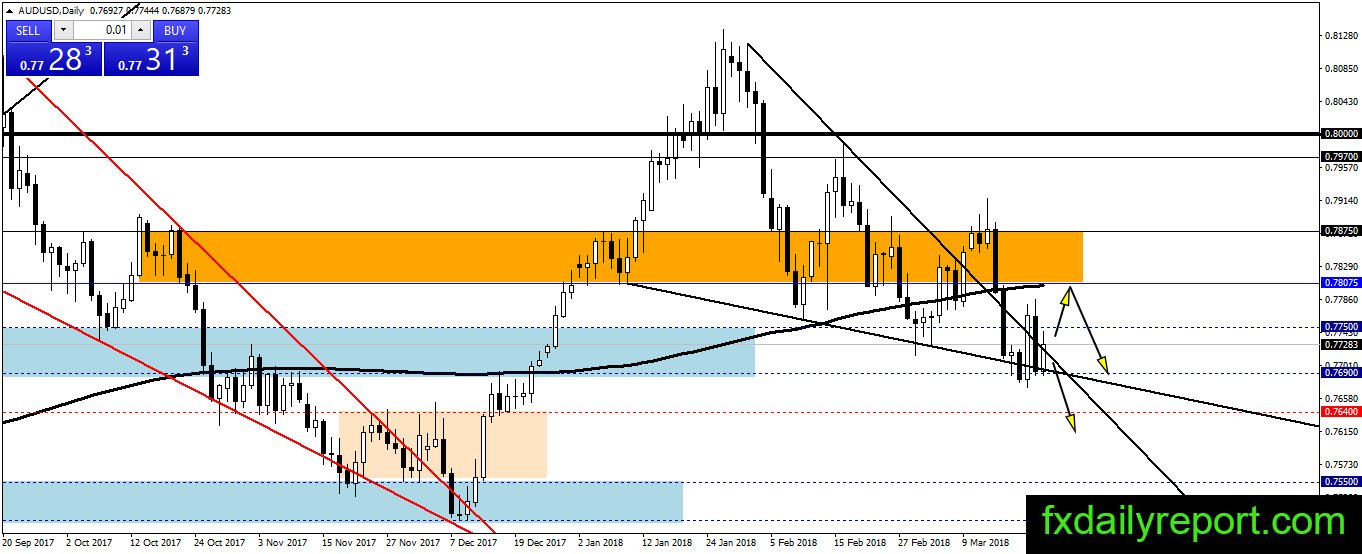
AUD/USD trapped inside the triangle and show no clue for next week direction. The pair initially breakdown and made successful retest on a level near daily SMA 200. However, it looks like the bearish momentum is not enough to break 0.7690 support level.
A long position could be taken from a level near 0.7690, on the other hand, the bearish position could be taken from a level near daily SMA 200.
Today critical level to watch:
Support: 0.7690, 0.7640
Resistance: 0.7750, 0.7800, 0.7875, 0.7970