
USDX (USD Index)
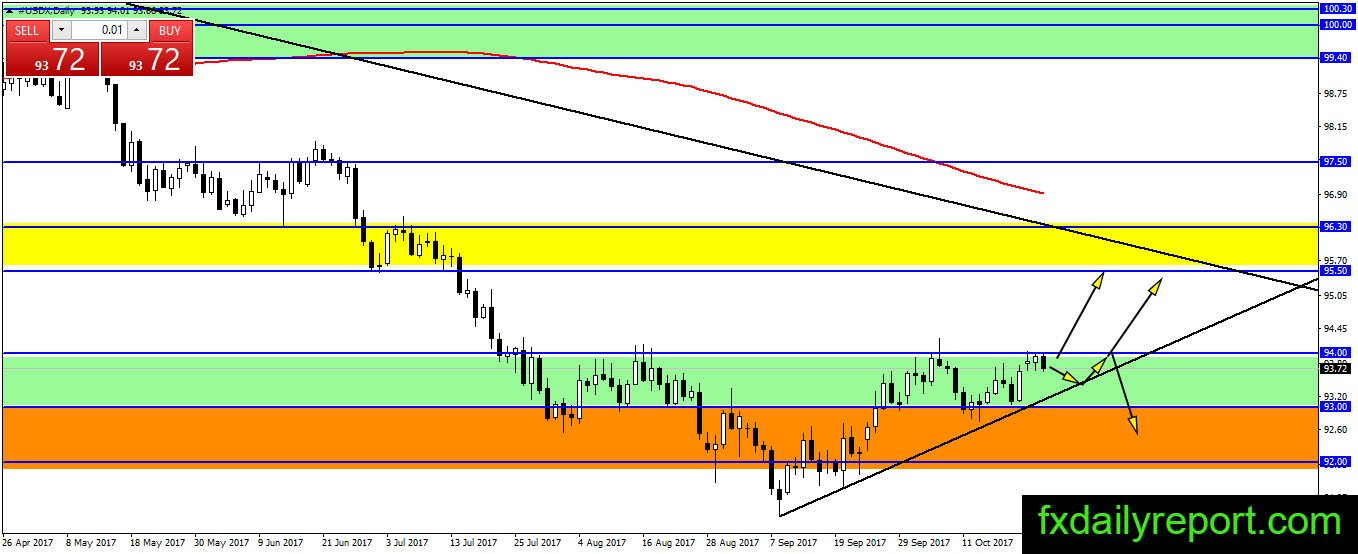
U.S dollar index stopped at 94.00 resistance as expected and there is weakness sign today as the index moves lower. The move has not crossed below previous day low which is good for the bull. However, if the index continues lower and closes below previous day low, it might test the trendline. Tomorrow, the market will wait for ECB interest-rate decision which could impact market sentiment. Will Euro bull come and drive the currency up? Alternatively, will the bull push U.S dollar

Will Euro bull come and drive the currency up? Alternatively, will the bull choose U.S dollar for the rest of year?
News to watch
04.30 AM UK Prelim GDP, actual data 0.4% vs. consensus 0.3%
08.30 AM U.S Core Durable Goods Orders actual 0.7% vs. consensus 0.5%
10.30 AM U.S Crude Oil Inventories forecast deficit of 2.6 million barrels.
For full outlook for this week, you can follow Forex Outlook For The Week 23 – 27 Oct 2017
Technical Analysis
EUR/USD
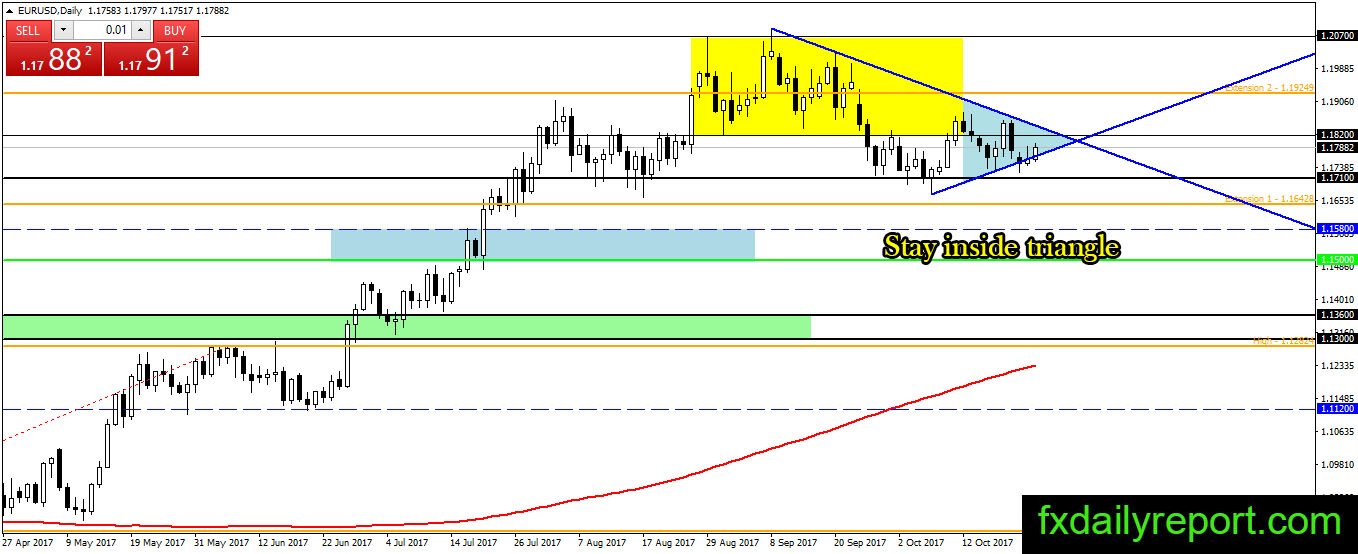
EUR/USD under pressure, but there is no breakout below blue triangle, and the pair currently bounces from the bottom of the triangle. We expect the pair will continue inside the triangle until ECB interest-rate decision tomorrow.
Today critical level to watch:
Support: 1.1710, 1.1650
Resistance: 1.1820, 1.1900, 1.1920, 1.2000
GBP/USD
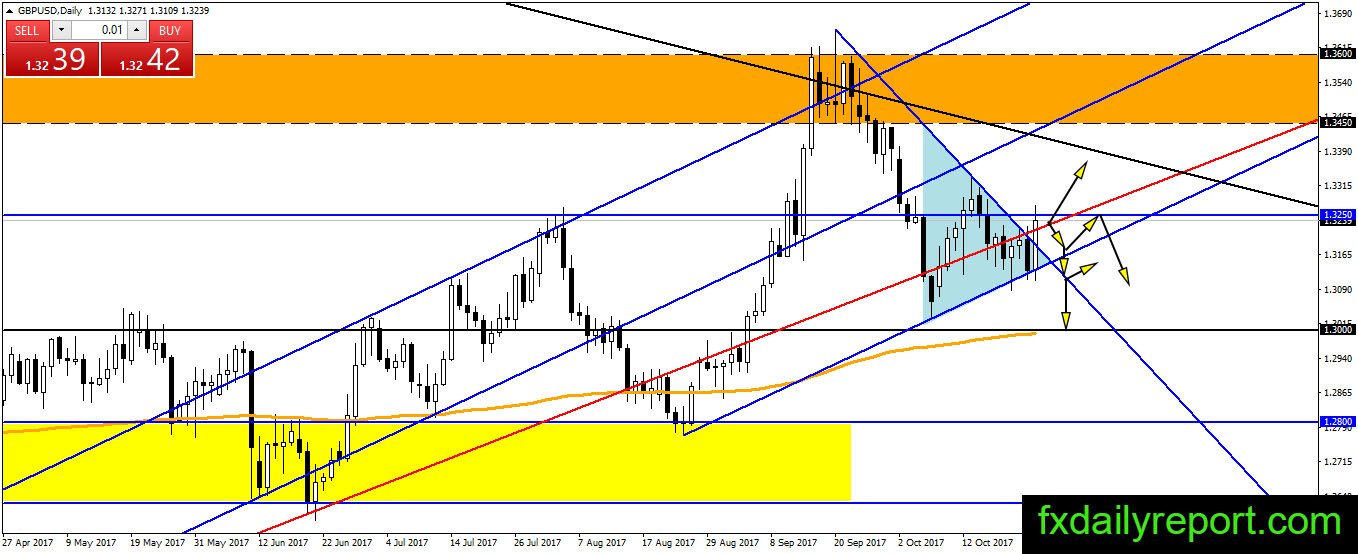
GBP/USD better than expected prelim GDP data move the pair up and break the triangle consolidation. The breakout is valid, but the pair has not made up its mind to cross above 1.3250 resistance. If GBP/USD continues to stay below the resistance by the end of the day, it might lead to false breakout and reverse in the next day trading session.
Today critical level to watch:
Support: 1.3000
Resistance: 1.3250, 1.3300, 1.3342
USD/JPY
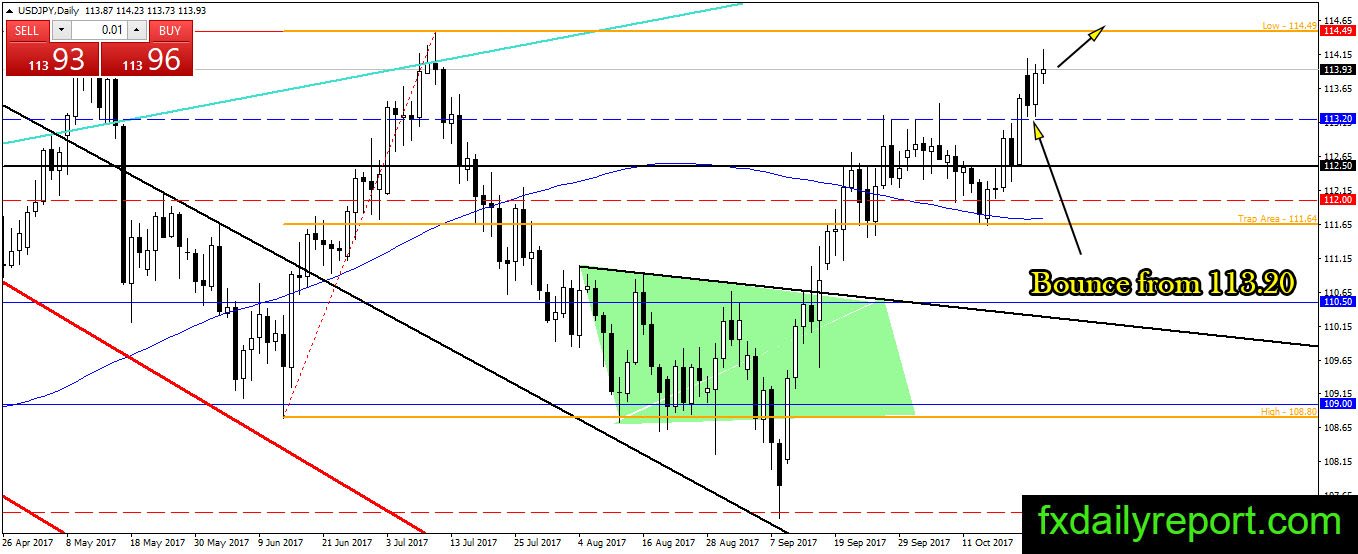
USD/JPY formed two candlesticks with an identical low in the previous day, and the bull is in control today. The pair getting near 114.50 and might reach it in several days. Traders could continue to stay sideways if not holding any position after the re-test of the level near 113.20. If the pair is losing strength between 114.50 – 115.00, it is an initial indication to enter a short position.
Today critical level to watch:
Support: 113.20, 112.50, 112.00, 111.60
Resistance: 114.50, 115.00
AUD/USD
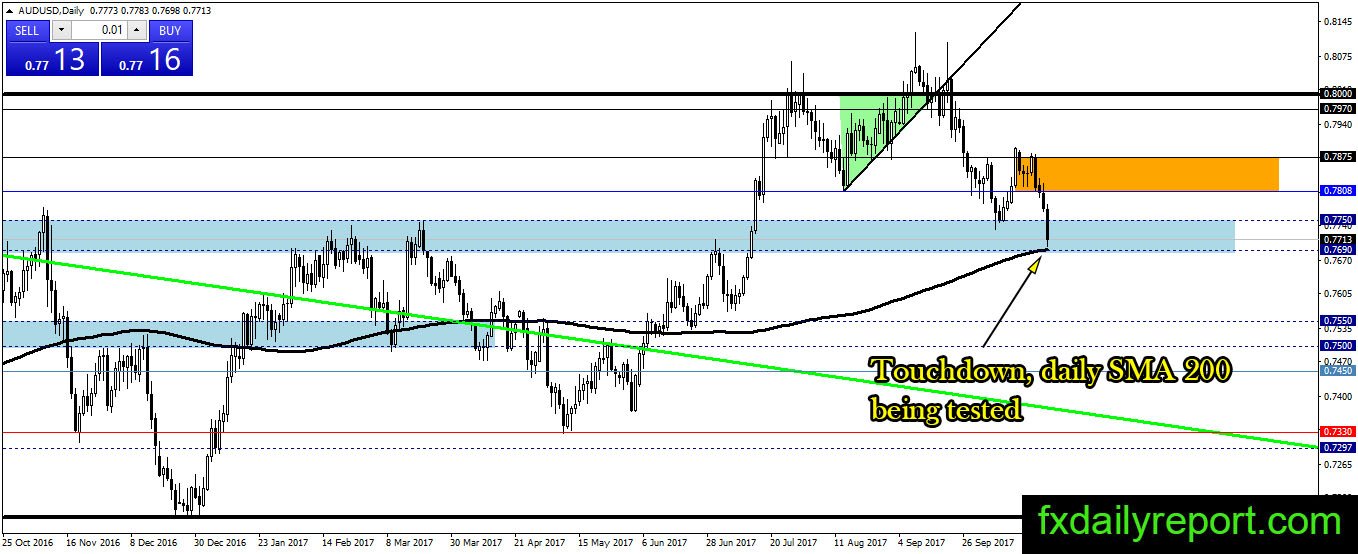
AUD/USD breakout of yellow range and continue toward daily SMA 200 without any trouble. The touch of daily SMA 200 concluded short-term target and the pair expected to halt position near the averages. If the bull could reverse the bearish sentiment and print a bullish pattern, AUD/USD could start a new bullish leg.
However, the probability of medium-term bounce is low as U.S dollar index keep haunting its resistance. The upside breakout in U.S dollar index is medium term – long term confirmation the trend change.
Today critical level to watch:
Support: 0.7690
Resistance: 0.7750, 0.7800, 0.7875