
The EUR/USD currency pair has dropped more than 600 pips over the last four weeks. Much of this drop was attributed to the strength of the USD as it gained advantage following a series of impressive macro data, another rate hike in March, and a multi-year high in the benchmark bond yield that hit 3% in April.
On the contrary, while the European Central Bank maintains steady economic growth forecast for the EU economic zone, the region remains on the mend and this means that the Euro has nothing much in its locker to score against major currencies. Those are the key fundamental views looking at the two economic zones. But there was also a technical aspect to the EUR/USD plunge.

As demonstrated on the daily chart below, the pair slipped outside of what appeared to be a moderately descending channel to form a sharply descending mini channel. The top wider channel could also be interpreted as a sideways movement, which pretty much explains the consolidation the EUR/USD currency pair experienced following the interim rally that began in December 2017.
Therefore, some experts suggest that the current move downwards could also be a case of market correction. So, if that’s the case, what could traders be looking at in terms of profit opportunities?

The debate now is on whether the pair will climb back to trade inside the main descending channel or it will continue to crater downwards in the current minor channel.
The bulls will be hoping it is the former, in which case they could target profits at (R1), which is pegged on the psychological 1.1800 level resulting in a little over 30 pips in profits or at about 1.1845, which is just before the next resistance zone 1.1936 (R2) for better margins.
If the pair manages to endure those key resistance zones and edge higher, then (R3) at another key psychological level 1.2000 could become an attractive target for the bulls.
Nonetheless, the bulls will also be looking at two key support levels to trigger the anticipated rebound upward denoted by (S1) at around 1.1700 level and (S2) at around 1.1600. The two levels also make good profits targets for the bears given the current momentum in the EUR/USD pair.
But is a rebound possible, and if it happens, how long could it last? Well, the weekly chart below has a clearer image on potential direction of the EUR/USD pair.
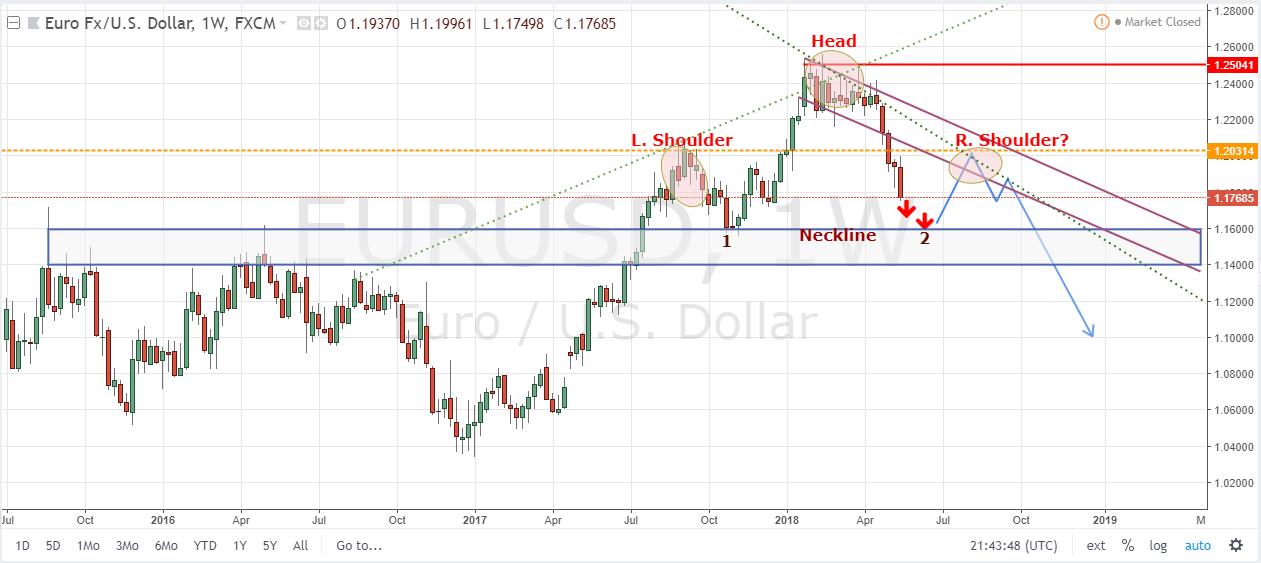
The chart seems to suggest that the pair could be in the process of forming a ‘head and shoulders’ pattern, which basically means that once the formation of the second ‘shoulder’ is complete, then we could see even a bigger breakout downwards than the one witnessed over the last few weeks.
Currently, the ‘left shoulder’ appears complete as does the ‘head’ while the ‘neckline’ also looks like it will be perfectly horizontal once the ‘right shoulder’ is formed. If these projections turn out to be correct, then profit opportunities for the bulls will be at around 1.1950 and 1.2000 which pretty much confirm the theory derived from the daily chart.
Bulls might also have to wait a couple of shifts downwards as denoted by the two red bearish arrows above for a rebound to occur.
If the EUR/USD pair drops as anticipated and proceeds to trade at around the neckline at 1.1600, it would be the first time it fallen below 1.1700 since October last year.
The EUR/USD currency pair has barely traded around the 1.1400 to 1.1600 zone over the last three years, which means that a consolidation at this level is unlikely. So, once the pair hits 1.1600, traders will be eagerly looking for a rebound or a fast train down towards the 1.1200 to 1.1400 zone.
The latter (continuous drop) looks highly unlikely at this point, which again upholds the theory of a potential rebound once 1.1600 is tested. The rebound will then push the EUR/USD currency pair up top to form the ‘right shoulder’ of the ‘head and shoulders’ pattern.
Then of course, given the general strength of the US Dollar against the Euro, the upward momentum is likely to wane as the pair approach the previous high reached when forming the ‘left shoulder’. This could prompt the bulls to take profits thereby triggering the next shift downwards.
In summary, once the ‘head and shoulders’ formation is complete, the pair could technically have enough momentum to break further south towards 1.1200 or even towards parity at 1.1000. But opportunities now are bearish short-term, bullish intermediate, and bearish again for long-term traders.