
GBP/USD is trading in the red on the short term and seems determined to drop much deeper in the upcoming days after the false breakout above a dynamic resistance. I’ve told you in the previous days that the perspective remains bearish on the Daily chart.
We had only a temporary rebound as the USD was punished by the USDX’s drop. The USD has taken the lead again on the short term as the USDX has managed to jump higher. It is very important to see what will really happen on the USDX, which is pressuring a very, very strong dynamic resistance.

The UK’s Services PMI increased from 53.5 to 54.3, beating the 53.9 estimate and signaling that the expansion continues to increase. The US is to release the Trade Balance, which could decrease from -46.3B to -50.2B.

Unfortunately, the USDX has failed to jump and close above the 50% Fibonacci line. Now is trading much below this dynamic resistance. It remains to see what will really happen in the upcoming days because a failure to make a valid breakout above this line will send the rate down again, so the USD will depreciate again.
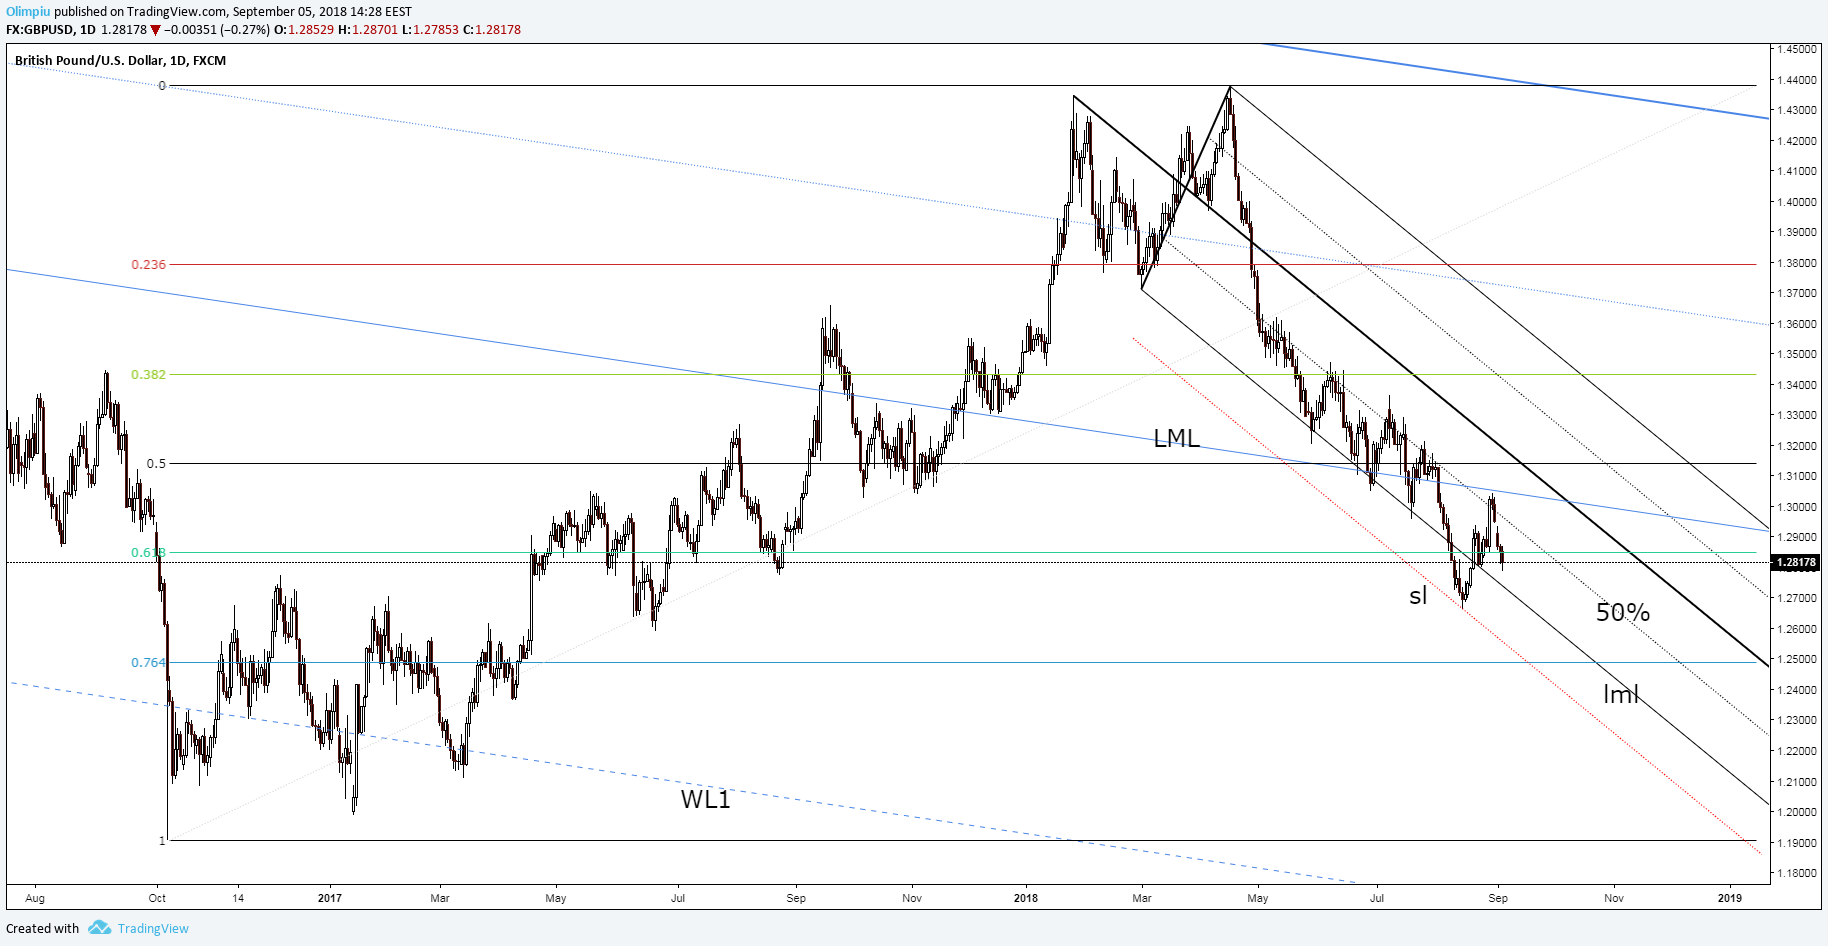
GBP/USD has plunged since the last report. I’ve told you that the perspective remains bearish on the Daily chart after the failure to reach and retest the lower median line (LML). It has made only a false breakout above the 50% Fibonacci line and now is almost to reach the lower median line (lml) of the minor descending pitchfork.
Price is pressuring the 61.8% retracement level, so a valid breakdown will announce a further drop towards the 1.2661 former low. The perspective remains bearish as long as the rate stays below the 50% Fibonacci line, so it could try to approach the outside sliding line (sl) and the 76.4% retracement level in the upcoming period