
The Great Britain Pound (GBP) slid down against the US Dollar (USD) on Tuesday, decreasing the price of GBPUSD to less than 1.2800 following some major economic releases. The technical bias may remain bearish because the pair’s price marked a higher low in the recent upside move.
GBP/USD Technical Analysis
As of this writing, the pair is being traded around 1.2754, a support can be seen around 1.2744, an immediate trend line support ahead of 1.2700, the psychological number then comes a key horizontal support level around 1.2660, as demonstrated in the given below chart.

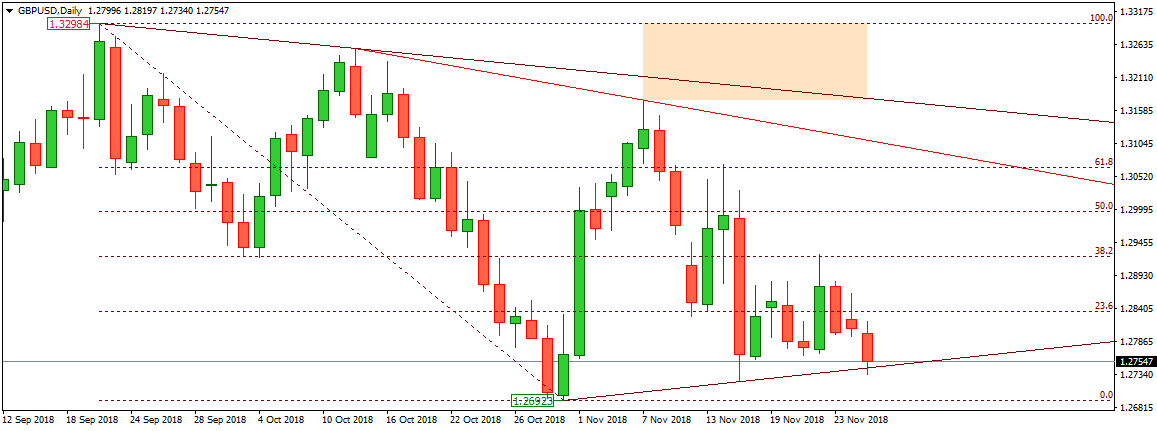
On the upside, a resistance can be witnessed around 1.2928, the major horizontal resistance. Another resistance level may come at 1.3093, the 61.8% Fib level resistance ahead of 1.3243, the trend line resistance level as demonstrated in the given above chart. The technical bias shall remain bearish as long as 1.2928, the major horizontal resistance level remains intact.
UK’s GDP News
In Great Britain, the figure concerning the GDP (Gross Domestic Product) remained 0.0% in August, as compared to 0.4%t during the month before, down beating the economist expectation which was 0.1%. The date is sourced from a news released by the National Statistics, United Kingdom.
The figure represents a net worth of all products including goods and services produced in the country. It’s a matter of fact the news with respect to GDP is usually considered as the most anticipated economic news since it deals with the country’s economic health and performance over time. Generally speaking a rising trend in this regard indicates a bullish market for the Great Britain Pound (GBP) whereas a downward trend suggests a bearish market for the Great Britain Pound (GBP).
Trade Idea
Considering the overall price behavior of the pair over the last couple of days, selling the GBPUSD around current levels can be a good decision in short to medium term.