
The yellow metal is trading in the green and is struggling to approach and reach at least the 1212.74 former high. It could increase further if the USDX will force the USD to drop further versus it rivals. Gold tries to approach and reach a very strong dynamic resistance line, it remains to see how it will react when it will reach this upside obstacle.
The perspective remains bearish on the Daily chart for now because the rate is trapped below some very important resistance levels. We need a confirmation that the rate will really start an important upside movement.

Gold increased as the USD decreased despite some good numbers from the US. The Unemployment Claims dropped unexpectedly from 204K to 201K, even if the specialists have expected to see an increase to 210K in the previous week. The Philly Fed Manufacturing Index was reported at 22.9 points, higher versus the 17.5 points. Unfortunately, the Existing Home Sales have remained steady at 5.34M, despite the 5.36M estimate, while the CB Leading Index rose only by 0.4%, less versus the 0.5% estimate.
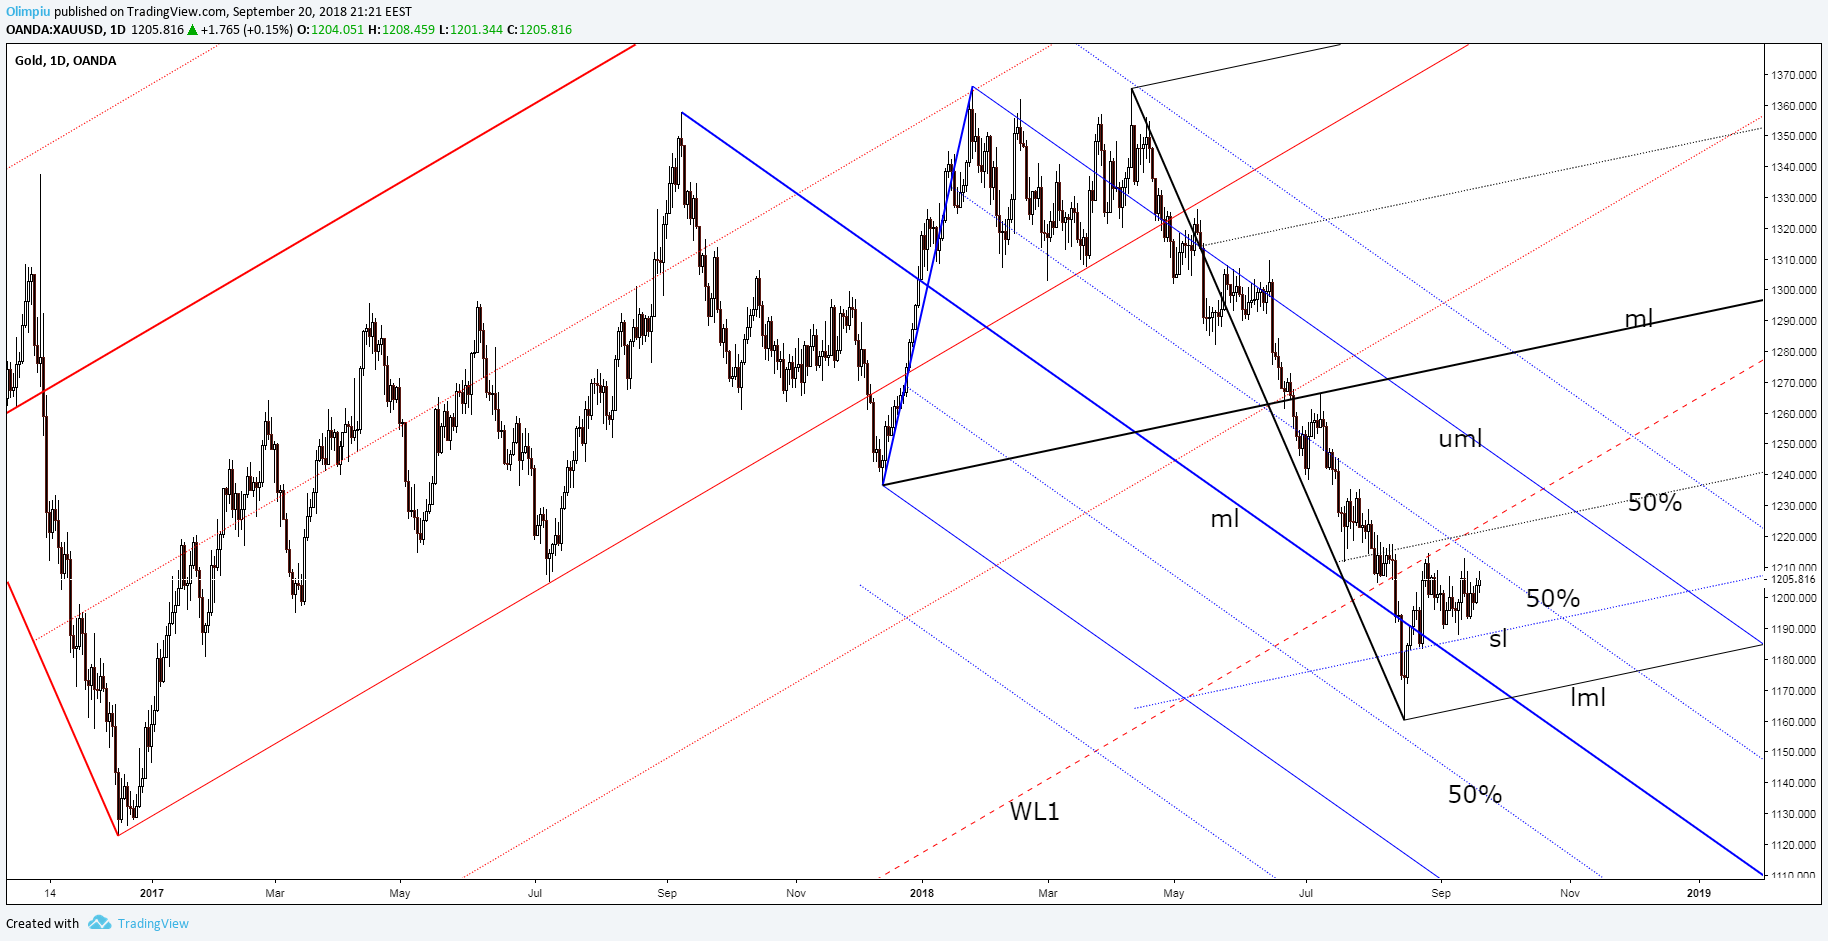
Gold has failed to test and retest the inside sliding line (sl) of the black ascending pitchfork signaling that it could increase. It has also failed to retest the median line (ml) of the descending pitchfork and now could reach the upside 50% Fibonacci line. A valid breakout could send the rate towards the downside 50% Fibonacci line of the black ascending pitchfork and towards the upper median line (uml) of the descending pitchfork. Personally, I believe that only a valid breakout above the downside 50% line of the black ascending pitchfork it will really confirm a larger upside movement. A failure to reach this line or a false breakout will send the rate down again and most likely it will make a valid breakdown below the inside sliding line (sl).