
The GBP/EUR currency pair is currently trading within a bearish channel that looks set to take the exchange rate between the Sterling and the Euro down further.
The pair has been trending downwards since hitting the current YTD high of about 1.1600 last month during a short-term bullish spike that followed a prolonged sideways movement. This spike also came around the time when investors had optimism that the Bank of England would announce another rate hike within a month.

During the recent decline in the GBP/EUR exchange rate, the plunge has been characterized by a series of lower highs and lower lows, which also coincide with key fiscal policy announcements by the Bank of England that turned out to be dovish.
On the other hand, the European Central Bank has remained optimistic on the region’s economic recovery, albeit making sure not to raise unnecessary optimism on expectations. As such, the Euro has been significantly stronger and stable in recent weeks, and this is what has given it the edge against the Sterling.
The 4-hourly chart suggests downward momentum will continue
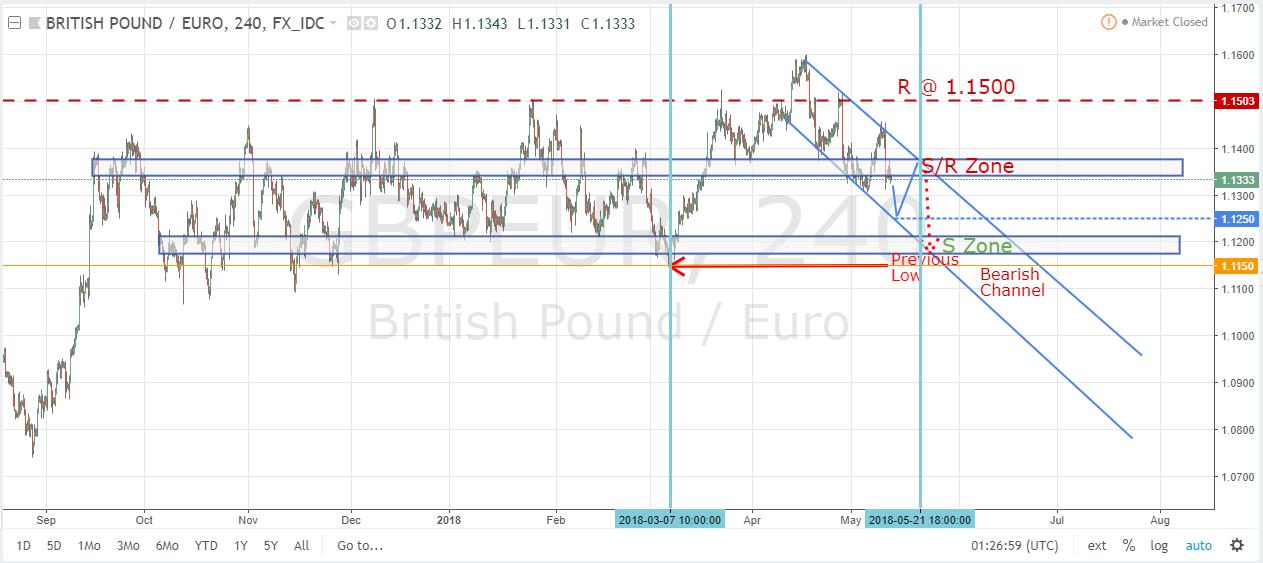
Based on the 4-hourly chart above, traders will be looking at the potential of the pair hitting its previous low of about 1.1150 in the next few weeks. The pair last traded at this level during the first week of March 2018, which also marked the beginning of the upward movement that took the GBP/EUR to the current YTD high of 1.1600.
However, the pair will have to overcome a key support zone (S Zone) at about the 1.2000 level to drop to 1.1150. That is not inconceivable especially when you look at the angle of the bearish channel that the pair has traded within since the middle of April 2018.
Nonetheless, it might take time before it finally breaches this key support zone, with the pair first expected to rebound at around the 1.1250 level. The rebound could take it to another key level, which over the last 12 months has acted as both a major support and resistance zone (S/R Zone) between the 1.1300 and 1.1330 levels.
The picture is even clearer when you look at the pair using the daily chart. And is there a bearish triangle formation?
The downward momentum looks stronger in this case, with GBP/EUR currency pair forming what looks like a bearish triangle. The pair has already touched three key points at the top of the downward sloping triangle while two rebound levels have been tested on the base of the triangle. Looking at the current trajectory of the pair, it looks like the third point could be confirmed in the next few months if not weeks.
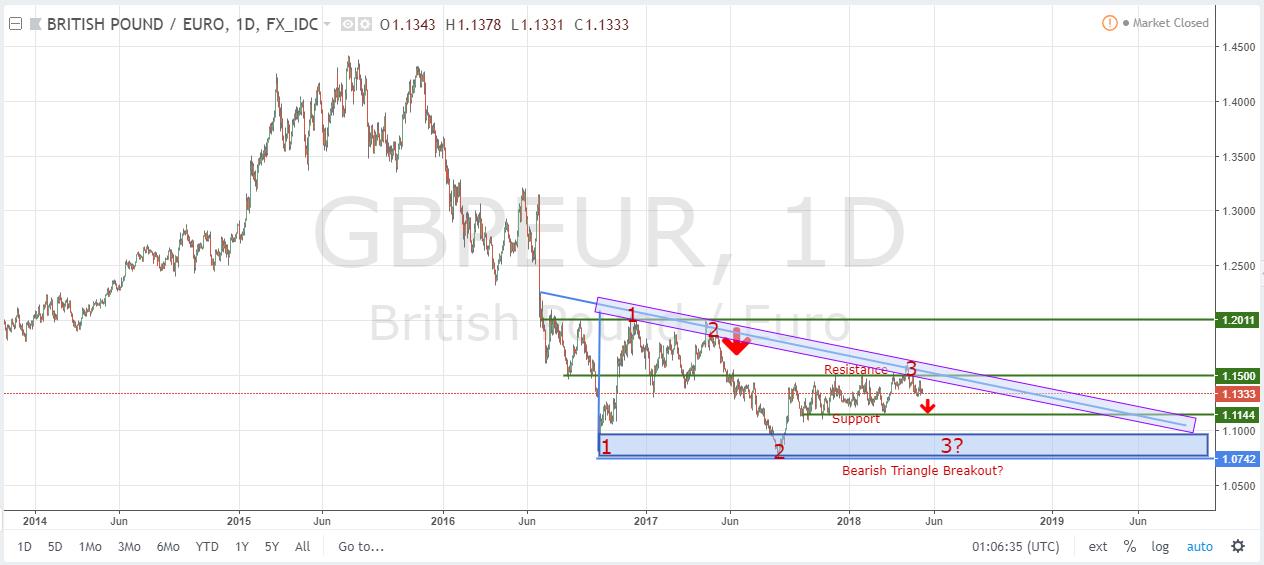
From there on, traders can expect the GBP/EUR currency pair to either breakout earlier before the completion of the triangle or continue to trade within the triangle formation pattern potentially till the end of the year or mid-next year.
So, would we eventually see parity in GBP/EUR currency pair?
The Euro could continue to strengthen against the Pound for the next several months, which could eventually lead to parity. Brexit has not helped the U.K. economy as most Britons anticipated. In fact, analysts fear that it could have made things worse. And with political infighting still taking its toll on the economy, analysts are predicting a potentially weaker Pound in the next few months.
Whether that weakness brings the GBP/EUR currency pair to parity is another question, but looking at the daily chart above, it seems very likely.
Since the global financial crises of 2008 to 2009, the pair has dropped to trade below 1.1000 on two occasions. The first one happened a few months after the Brexit vote while the other one happened in September last year.
Both occasions coincided with the two times that the pair touched the base of the bearish triangle. It is also good to note that the U.K. Prime Minister Theresa May triggered Article 50 in March last year. Since then, there have been a series of negotiations with the EU, which have not gone well, and they could have an adverse effect on the U.K. economy.
Therefore, it looks likely that when the GBP/EUR touches the base of the bearish triangle again, it might do so at a level well below the 1.1000, potentially at about 1.0700. This could also usher in a breakout that often happens after such a triangle pattern is formed.
In more than 60% of the time, the breakout is bearish while in about 30% the breakout turns out to be bullish. The 10% usually takes the pair in an indifferent direction before a major change in the trend. If the GBP/EUR breaks out downwards after the formation of the bearish candle is complete, then it is possible we could see parity in the pair soon. That’s when the GBP/EUR exchange rate oscillates within a few pips of 1.0000 either direction.