
The GBP/USD currency pair dropped on Monday morning to trade below the 1.2650 level for the first time in 12 days. The pair broke out from a short-term consolidative pattern formation to test the new lows after the UK reported what traders interpreted to be weak economic data.
Early in the afternoon, the GBP/USD currency pair appeared to make an immediate recovery, but that rebound was soon cut short as it edged lower to retest session lows.
GBP/USD Fundamentals Overview

From a fundamental perspective, the GBP/USD currency pair is trading at the back of weak UK data and a US-China trade truce. These contradicting events give the advantage to the greenback, which explains why the Sterling Pound’s attempt to recover from the early morning fall proved fruitless.
The US personal income data, which came in in the afternoon and bear 0.3% expectation with 0.5% growth might have also played a part in the loss of upward momentum.
The UK Markit Manufacturing PMI fell to 48.0 points from 49.4 points in the previous period and missed expectations of 49.2. Mortgage approvals and consumer credit also fell adding pressure to the Pound Sterling.
GBP/USD Technical Analysis (the 60-min Chart)
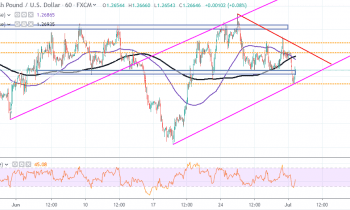
From a technical viewpoint, the GBP/USD currency pair appears to be trading within an ascending channel in the 60-min chart, which suggests a short-term bullish bias. As such, the latest pullback could be short-lived with another rebound back up expected.
The pair has recently bounced off the trendline support, which suggests that the bulls could be more optimistic going into the next few days. They could target profits at around 1.2700 level while the bears will look to pounce by targeting profits at around 1.2634.
GBP/USD Technical Analysis (the Daily Chart)
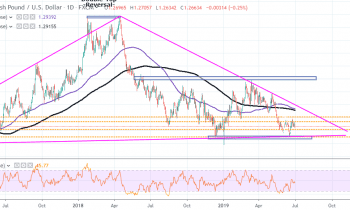
In the daily chart, the GBP/USD currency pair appears to be trading within a bearish channel that stretches back to March this year. This suggests that the bears still retain control over the long-term.
But when you stretch things further, the GBP/USD currency pair has been on a sideways movement since September last year. There are two distinct support and resistance zones which have held firm since then and they look like they could hold on for the foreseeable future.
In summary, the GBP/USD currency pair appears to enjoy a short-term bullish bias but the bears retain control in the long-term view.