
On Thursday, the GBP/USD currency pair bounced from the key support at about 1.2630 to trade at about 1.2688. The currency pair trades within an ascending channel formation in the 60-minute chart.
The pair has now ascended to trade a few levels above the 100-hour moving average line. As a result, the currency pair is on the verge of entering the overbought levels of the 14-hour RSI.
GBP/USD Fundamentals Overview

From a fundamental perspective, the GBP/USD currency pair trades after a relatively busy period in the U.S. market. On Wednesday, the U.S. personal consumption expenditures – price index for October matched the (MoM) and (YoY) expectations of 0.2% and 2.3%, respectively. The core personal consumption expenditures – price index for the period also came in line with the estimates of 0.3% (MoM) and 2.8% (YoY).
On the other hand, the personal income for October exceeded the expectation of 0.3% with a change of 0.6%, while personal spending outshone 0.3% with a change of 0.4%. The pending home sales for October also beat the forecasted (MoM) change of -1.3% with a change of 2%.
The durable goods orders for October missed the expected change of 0.5% with a change of 0.2%, while the durable goods orders ex-transportation fell short of 0.2% with a change of 0.1%. The Chicago Purchasing Managers’ Index for November failed to match the expectation of 44.7 with a reading of 40.2, while the initial jobless claims for the week ending November 22 outperformed the forecasted claim count of 217k with a tally of 213k.
GBP/USD Technical Analysis (the 60-min Chart)
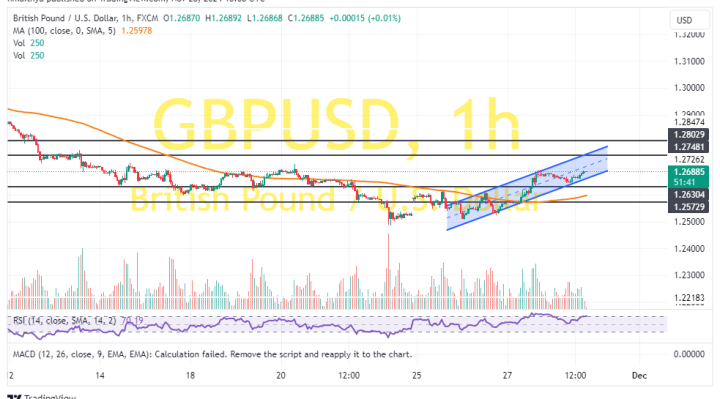
Technically, the GBP/USD currency pair trades within an ascending channel formation in the 60-minute chart. The 14-hour RSI has also advanced to move closer to the overbought levels of the indicator.
Therefore, the bulls will look to extend the current gains toward 1.2748 or higher to 1.2803. On the other hand, the bears will look to pounce on pullbacks at about 1.2630 or lower at 1.2573.
GBP/USD Technical Analysis (the Daily Chart)
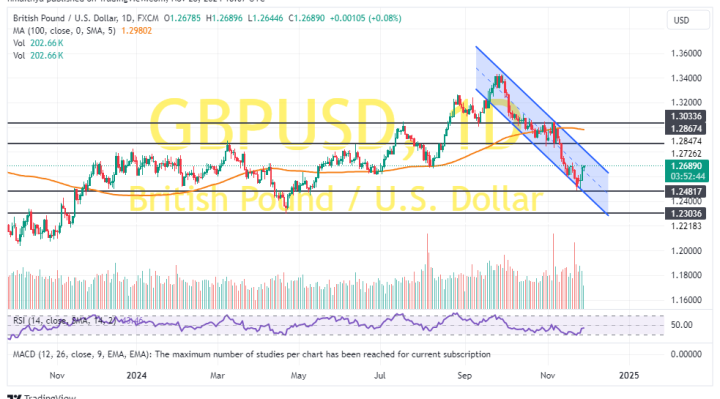
In the daily chart, the GBP/USD trades within a descending channel formation. However, the 14-day RSI has bounced back to avoid falling into oversold conditions.
Therefore, the bulls will look to stretch the current rebound towards 1.2867 or higher to 1.3033. On the other hand, the bears will look to extend the current decline toward 1.2481 or lower to 1.2303.