
The GBP/USD currency pair on Friday spiked to complete an upward breakout from a descending channel formation. The currency pair later pulled back after funding resistance at 1.2042 to trim the session gains.
The currency pair remains pinned above the 100-hour moving average line in the 60-min chart. Friday’s late pullback prevented the pair from advancing to the overbought conditions of the 14-hour RSI.
GBP/USD Fundamentals Overview

From a fundamental perspective, the GBP/USD currency pair is trading at the back of a relatively busy period in both markets. On Friday, the UK retail sales for June outperformed the expected (MoM) change of -0.3% with a change of -0.1%. The (YoY) equivalent came short of -5.3% with -5.8%.
On the other hand, retail sales ex-fuel beat both the (MoM) expectations of -0.4% and -6.3%, respectively with 0.4% and -5.9%. Elsewhere the preliminary S&P Global/CIPS Services PMI for July beat the expectation of 53 with 53.3. The CIPS Composite and Manufacturing PMIs also outshone 52.5 and 52, respectively with 52.8 and 52.2.
In the US, the preliminary S&P Global manufacturing PMI beat the expectation of 52 with 52.3. On the other hand, the Composite and Services equivalents missed 51.7 and 52.6, respectively with 47.5 and 47. Earlier in the week, the US initial jobless claims for last week missed the expectation of 240k with a claim count of 251k. On the other hand, continuing claims for the preceding week came short of 1.34 million with a tally of 1.384 million.
GBP/USD Technical Analysis (the 60-min Chart)
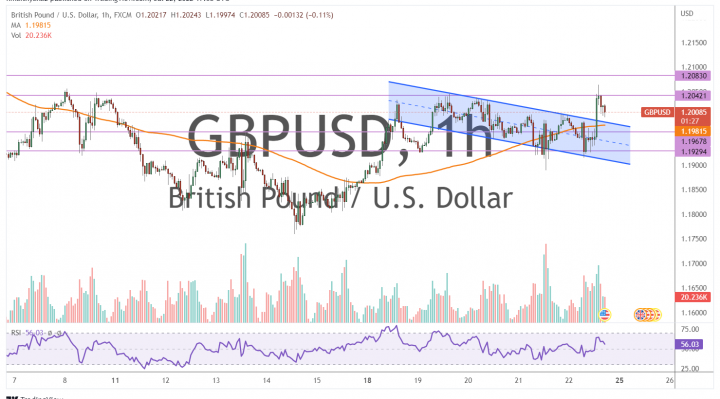
Technically, the GBP/USD currency pair seems to have recently completed a bullish breakout from a gently descending channel formation. This indicates an attempt by the bulls to take control of the pair.
Therefore, they will be looking to extend the current rebound towards 1.2042 or higher to 1.2083. On the other hand, the bears will be targeting potential pullback profits at about 1.1967, or lower at 1.1929.
GBP/USD Technical Analysis (the Daily Chart)
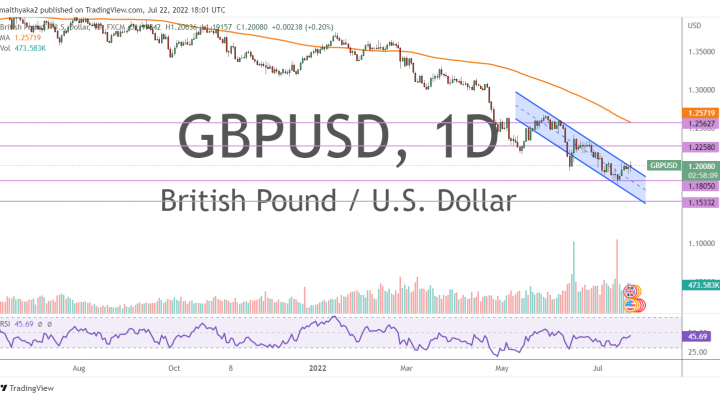
In the daily chart, the GBP/USD currency pair seems to be trading within a descending channel formation. This indicates a significant long-term bearish bias in the market sentiment.
Therefore, the bears will be looking to extend the current declines toward 1.1805 or lower to 1.1533. On the other hand, the bulls will look to pounce on profits at about 1.2258, or higher at 1.2562.