
The GBP/USD currency pair on Friday continued to trade lower towards current 3-week lows following Thursday’s decline. The currency pair has now fallen off the slightly ascending channel in the 60-min chart. This indicates an attempt by the bears to take control of the pair in the short-term.
The currency pair is now trading closer to the oversold levels of the 14-hour RSI. The 100-hour and the 200-hour SMA line are pinned higher above it. A temporary rebound could be on the horizon.
GBP/USD Fundamentals Overview

From a fundamental perspective, the GBP/USD currency pair is trading at the back of a relatively busy period in the US market. On Thursday, the preliminary US gross domestic product for Q3 beat the expected annualized change of 31% with a change of 33.1%. The preliminary gross domestic product price index also outshone the estimate of 2.8%with a change of 3.7%.
On the other hand, core personal consumption expenditures missed 4% with a change of 3.5%. Elsewhere, the initial jobless claims for the week ending October 23 beat the expected tally of 775k with a count of 751k while continuing claims came in slightly higher than expected at 7.756M versus 7.7M.
In the UK, Mortgage approvals for September beat the expected count of 76.112k with a tally of 91.454 approvals. On Friday, the seasonally adjusted change in Nationwide housing prices for October beat the (MoM) expectation of 0.4% with 0.8%. The non-seasonally adjusted equivalent outshone the (YoY) expectation of 5.2% with 5.8%.
GBP/USD Technical Analysis (the 60-min Chart)
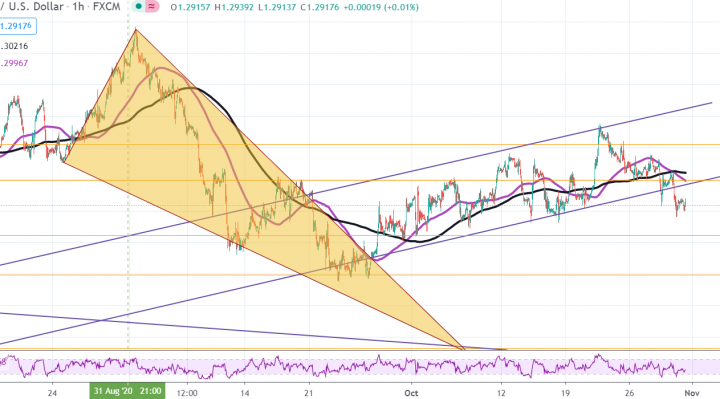
Technically, the GBP/USD currency pair appears to have recently dropped off an ascending channel in the 60-min chart. This indicates an attempt by the bears to take control of the market in the short-term.
They will be targeting short-term profits at around 1.2821 or lower at 1.2697. On the other hand, the bulls will look to pounce for profits at around 1.2997 or higher at 1.3110.
GBP/USD Technical Analysis (the Daily Chart)
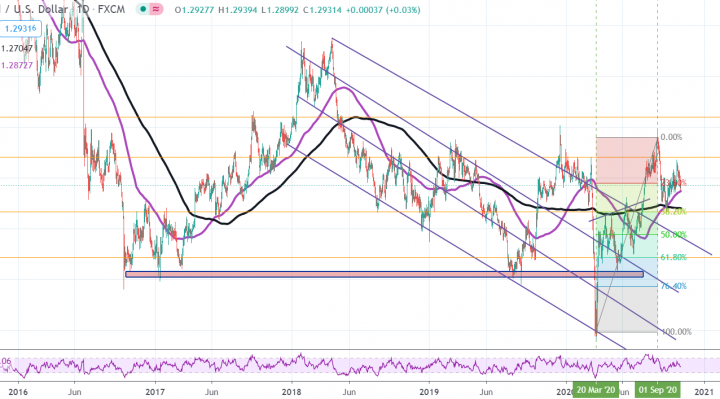
In the daily chart, the GBP/USD currency pair appears to have recently rebounded following a temporary pullback. The pair is now pinned at the 23.60% fib level off its yearly highs. It also enjoys strong support off the 100-day SMA.
The bulls will target long-term profits at around 1.3207 or higher at 1.3599. On the other hand, the bears will look to pounce for profits at around 38.20% and 61.80% Fib levels at 1.2670 and 1.2218, respectively.