
The GBP/USD currency pair on Friday extended the current weekly gains towards the 1.2500 key level following the latest round of UK data. The currency pair has been on a recovery trend since bottoming at a new multi-decade low last week. It has now rallied to edge towards the 61.8% Fib level, recovering of more than 60%.
Today’s surge has pushed the pair to overbought levels of the 60-min RSI indicator. This could trigger the next pullback. The pair also crossed over the 100-hour and the 200-hour SMA lines in mid-week.
GBP/USD Fundamentals Overview

From a fundamental perspective, the GBP/USD currency pair is trading at the back of a relatively busy period in both the UK and the US markets. The coronavirus pandemic has been wreaking havoc globally. This has affected financial markets. This has forced various central banks to cut interest rates closer to zero in a mid to stimulating the economy. The latest round of economic data for the UK and the US appears to favor the Pound Sterling.
On Tuesday, the UK preliminary Markit PMI for March missed the expectation of 45 with 35.7. On Wednesday, the Consumer Price Index for February matched the (YoY) expectation of 1.7%. On Thursday, the Bank of England MPC vote remained unchanged with the base interest rate remaining capped at 0.1%.
In the US, preliminary Markit Manufacturing PMI for March beat the expectation of 42.8 with 49.2. However, the Services PMI came short of expectations with 39.1 versus 42. Non-defense capital goods orders ex-aircraft for February missed the expectation of -0.4% with -0.8%. Initial jobless claims for last week also came out higher than expected with 3.283M versus 1M.
GBP/USD Technical Analysis (the 60-min Chart)
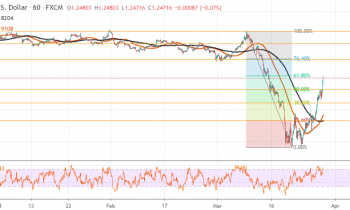
Technically, the GBP/USD currency pair appears to be trading under extreme short-term bearish bias in the market sentiment. The pair has already crossed over to overbought levels of the 60-min RSI. This could trigger an immediate pullback.
The bears will be targeting short-term pullback profits at around 1.2297 or lower at 1.2092. On the other hand, the bulls will look to pounce on profits at around 1.2761 or higher at 1.3000.
GBP/USD Technical Analysis (the Daily Chart)
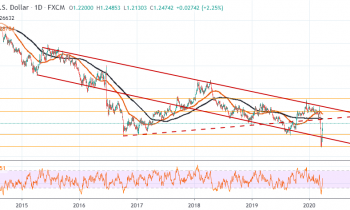
In the daily chart, the GBP/USD currency pair appears to be trading in a descending channel. This indicates a long-term bearish bias in the market sentiment. The pair has recently pulled off a major rebound after hitting multi-decade lows.
The bulls will look to extend the current recovery towards 1.3000 or higher at 1.3560. On the other hand, the bears will target rebound profits at around 1.1961 or lower at 1.1426.