
The GBP/USD currency pair on Friday failed to build on this week’s attempted recovery after falling to a new multi-decade low early in the week. The currency pair plunged on Thursday to trade at around 1.1409. It recovered on Friday to top 1.1940 but pulled back late on to trade at 1.1717.
The pair is facing strong resistance from the 100-hour SMA. It has since crossed to overbought levels of the 60-min RSI, which triggered Friday’s late pullback.
GBP/USD Fundamentals Overview

From a fundamental perspective, the GBP/USD currency pair is trading at the back of a busy week in both the UK and the US. Earlier in the week, the US cut the Funds Rate by 100 basis points to 0.25% down from 1.25% in the previous week. And on Thursday, the bank of England cut the base interest rate by 15 basis points to 0.1% down from 0.25% amid the impact of the coronavirus outbreak. This triggered a sharp decline in the GBP/USD currency pair.
On Tuesday, the UK ILO unemployment rate for the 3 months ended Jan. 2020 increased to 3.9% up from 3.8% in the previous month. Analysts were expecting an unchanged rate of 3.8%. Average earnings excluding bonuses also grew at a slower rate than expected with a (YoY) growth of 3.1% versus 3.2% for the 3 months ended January 2020. The claimant count and average earnings including bonuses came out better than expected.
In the US, the NY Empire State Manufacturing Index missed expectations with -21.5 versus 4. Retail sales also disappointed on all counts while industrial production beat 0.4% with 0.6%. However, initial jobless claims missed 216k with 232.25k.
GBP/USD Technical Analysis (the 60-min Chart)
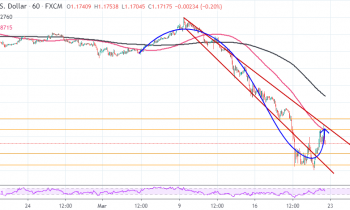
Technically, the GBP/USD currency pair appears to be attempting a short-term recovery. This comes after the pair bottomed at a new multi-decade low of 1.1409 on Thursday after the BOE’s rate cut.
Therefore, the bulls will be looking to extend short-term gains towards 1.1883 or higher to 1.2007. On the other hand, the bears will look to retain short-term control by targeting profits at around 1.1603 or lower at 1.1468.
GBP/USD Technical Analysis (the Daily Chart)

In the daily chart, the GBP/USD currency pair appears to have fallen sharply in the recent trading sessions. The pair traded at around 1.3200 on March 6 but has since plunged to bottom at 1.1409. This indicates a drastic shift in the market sentiment in favor of the bears.
The bears will be looking to extend current declines towards 1.1394 or slightly higher at 1.1409. On the other hand, the bulls will target long-term profits at around 1.2119 or higher at 1.2449.