
The GBP/USD currency pair on Thursday pulled back off the 100-hour moving average line to find support at about 1.1930. The currency pair continues to trade within a descending channel formation in the 60-min chart.
The pair has now plummeted to trade several levels below the 100-hour MA. However, the trendline support triggered a slight rebound preventing the currency pair from sliding further into the oversold conditions of the 14-hour RSI.
GBP/USD Fundamentals Overview

From a fundamental perspective, the GBP/USD currency pair is trading at the back of a relatively busy period in both markets. On Thursday, the US initial jobless claims for the week ending August 12 beat the expectation of 265k with a claim count of 250k. The continuing claims also outshone 1.438 million with a lower tally of 1.437 million. Earlier in the week, the US retail sales control group for July beat the expectation of 0.6% with a growth rate of 0.8%. On the other hand, general retail sales for the month missed the (MoM) forecast of 0.1% with a change of 0%.
In the UK, the consumer price index for July rose again to 10.1% (YoY) compared to a forecast of 9.8% and up from 9.4% posted in the previous month. The (MoM) change was 0.6% compared to an expectation of 0.4% but was lower than the previous month’s 0.8%. The non-seasonally adjusted core producer price index for July outperformed the expected (MoM) change of 0% with 1%. On the other hand, the (YoY) equivalent missed the forecast of 15.9% with 14.6%.
GBP/USD Technical Analysis (the 60-min Chart)

Technically, the GBP/USD currency pair seems to be trading within a descending channel formation in the 60-min chart. This indicates a significant short-term bearish bias in the market sentiment.
Therefore, the bears will be looking to extend the current declines toward 1.1840 or lower to 1.1737. On the other hand, the bulls will be targeting potential rebound profits at about 1.2025, or higher at 1.2114.
GBP/USD Technical Analysis (the Daily Chart)
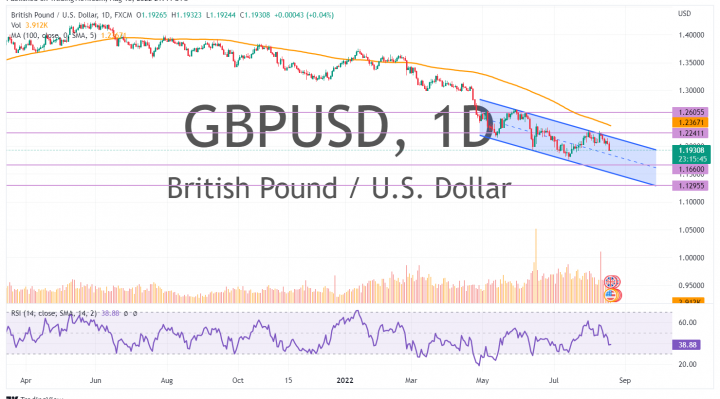
In the daily chart, the GBP/USD currency pair seems to be trading within a descending channel formation. This indicates a significant long-term bearish bias in the market sentiment.
Therefore, the bears will be looking to retain control of the pair by targeting profits at about 1.1660 or lower at 1.1295. On the other hand, the bulls will target potential rebounds at about 1.2241, or higher at 1.2605.