
The GBP/USD currency pair on Thursday pulled back off multi-week highs of about 1.2972 to settle at around 1.2900 following the latest round of US data. The currency pair has been significantly volatile this week oscillating between the 1.2900 and 1.2972 levels en route to completing a double-top reversal pattern.
The pair continues to trade in an ascending wedge, which suggests that despite Thursday’s sharp pullback, the bulls retain control going into Friday.
GBP/USD Fundamentals Overview

From a fundamental perspective, the GBP/USD currency pair is trading at the back of a significantly busy session in the US financial markets, but a relatively quiet period in the UK. While traders continue to look up to the Brexit progress for direction, things in the US-China trade talks have taken a negative turn in recent sessions.
This week, President Trump warned China that is they were to walk out of the ongoing trade negotiations, then they risk facing more trade tariffs. This comes just weeks after positivity had developed pointing to the potential conclusion of “phase one” in the trade talks as pointed out last month by Trump.
In terms of economic data, the US initial and continuing jobless claims for last week and the week ending November 8, respectively missed expectations of 219k and 1.685M with 226k and 1.695M. Earlier in the week, US housing starts for October also missed expectations but building permits beat the consensus estimate.
GBP/USD Technical Analysis (the 60-min Chart)
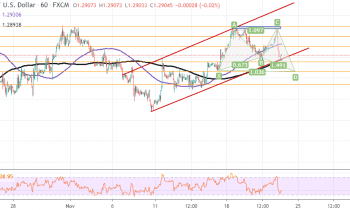
Technically, the GBP/USD currency pair continues to trade in an ascending channel, which indicates a short-term bullish bias in the market sentiment. However, after starting the formation of a XABCD reversal pattern, the trend could change soon.
Therefore, the bears will be targeting short-term profits at around 1.2889, 1.2860 or lower at 1.2835. On the other hand, the bulls will hope for a continuation of the current trend. They will target short-term profits at around 1.2925, 1.2949 or higher at 1.2972.
GBP/USD Technical Analysis (the Daily Chart)
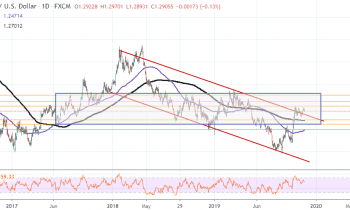
In the daily chart, the GBP/USD currency pair appears to be trading in a choppy pattern. The pair recently bounced off multi-year lows of about 1.2000 but has now rallied to trade close to a new 4-month high of about 1.3020. Both the 100-day and the 200-day SMA lines are located below the current level of the pair and this provides bullish support.
Therefore, the bulls will target long-term profits at around 1.3020, 1.3123, or higher at 1.3257. On the other hand, the bears will hope for a quick pullback towards 1.2704, 1.2609 or lower at 1.2490.