
GBP/USD long-term technical analysis
GBP/USD bull launched above 1.3600 at the start of the year following the weakness in U.S dollar index. In this month, U.S dollar index becomes the major driver of the currency market. The news from China which reduced their massive U.S bond buying send jitter to U.S stock market.
Aside from the China news, this week U.S government experienced shutdown as lawmakers could not agree on a spending bill. The talk currently underway to quickly reach an agreement between Democrat and Republic.

UK side continues progress in Brexit negotiation this year. There is opinion revolving in the market that second referendum might happen, pushed by parties which want to thwart Brexit. The deal has not reached yet, and EU will continue its attempt to put a huge penalty on the UK.
New Month
Monthly chart
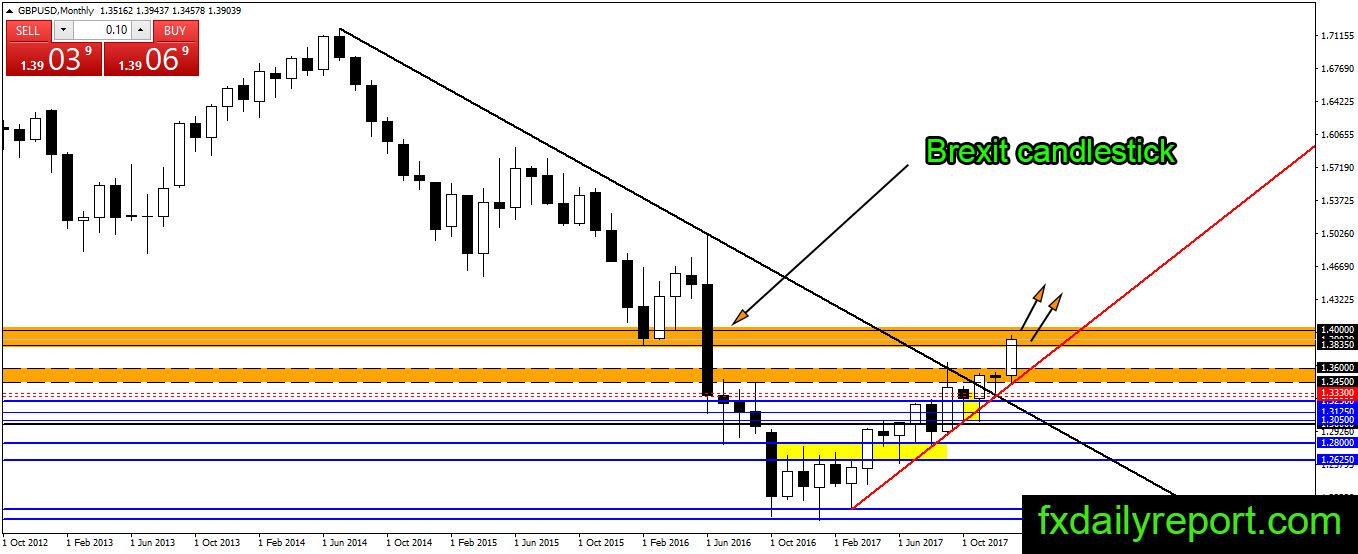
The monthly chart shows the bull dominance in January 2018. The pair jumped above 1.3600 and almost reached 1.4000. There is nothing to stop the bull yet, but at the current level, the upward momentum might slow as GBP/USD approaches the resistance.
Weekly chart
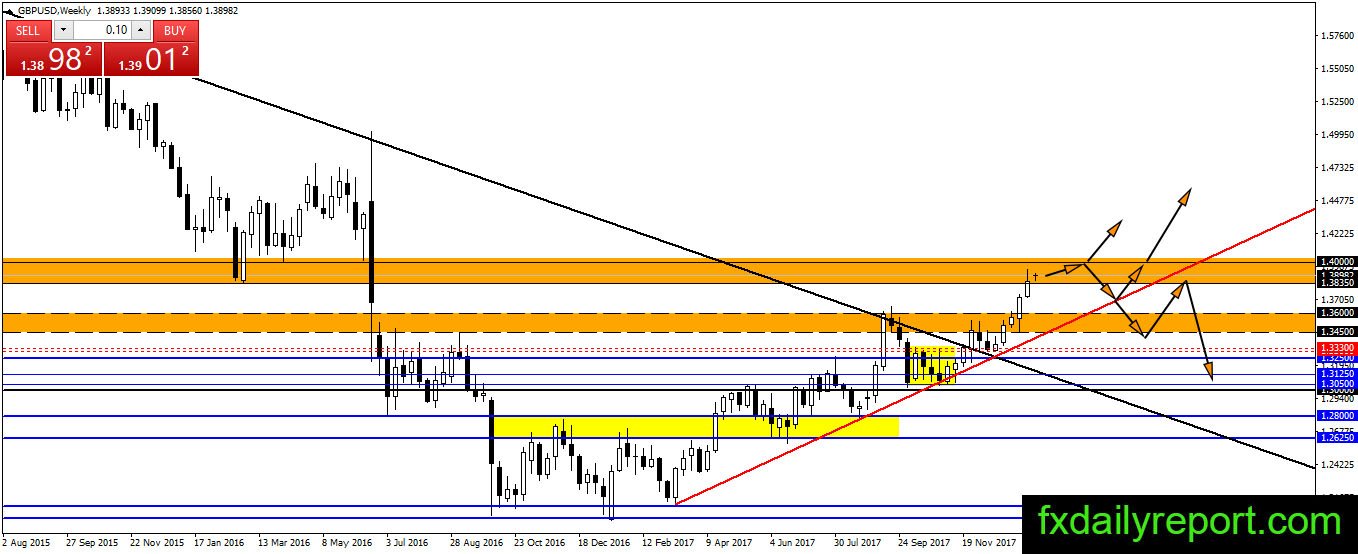
GBP/USD on the weekly chart mostly bullish, but this time the resistance is strong and might limit the pair from further upside. 1.4000 is the level of interest for short position. Meanwhile, the pair might trade between 1.3835 – 1.4000 until breakout happen.
Daily chart
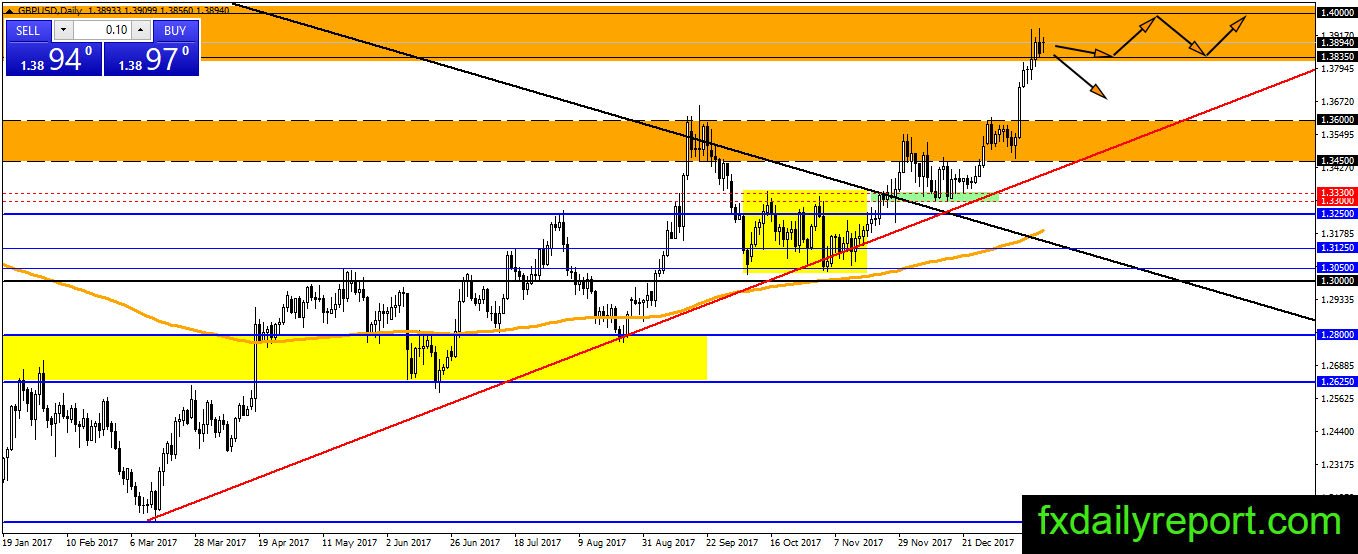
There is nothing to discuss on the daily chart, and the chart has a similar outlook to the weekly chart. The pair expected to trade between 1.3835 – 1.4000.
Trade plan
The long position could be taken near 1.3600 broken resistance and 1.3835 level.
The short position might need to wait until the pair produces major bearish reversal pattern at 1.4000