
GBP/USD long-term technical analysis
The overall trend of GBP/USD seems bearish, but at the end of the month, the bull manages to eke gain and averted further breakdown. The Brexit situation has not improved yet and the clock is ticking. Without any improvement then the direction of GBP/USD will continue downward.
From the U.S side, the Fed turned dovish in the previous month and traders interpret it as no more rate-hike this year. It means the U.S dollar will be under pressure globally. However, the trade war situation between the U.S and China has not solved yet and there is a looming trade war between U.S-EU. Expect no bullish scenario yet for GBP/USD for now.
New Month
Monthly chart

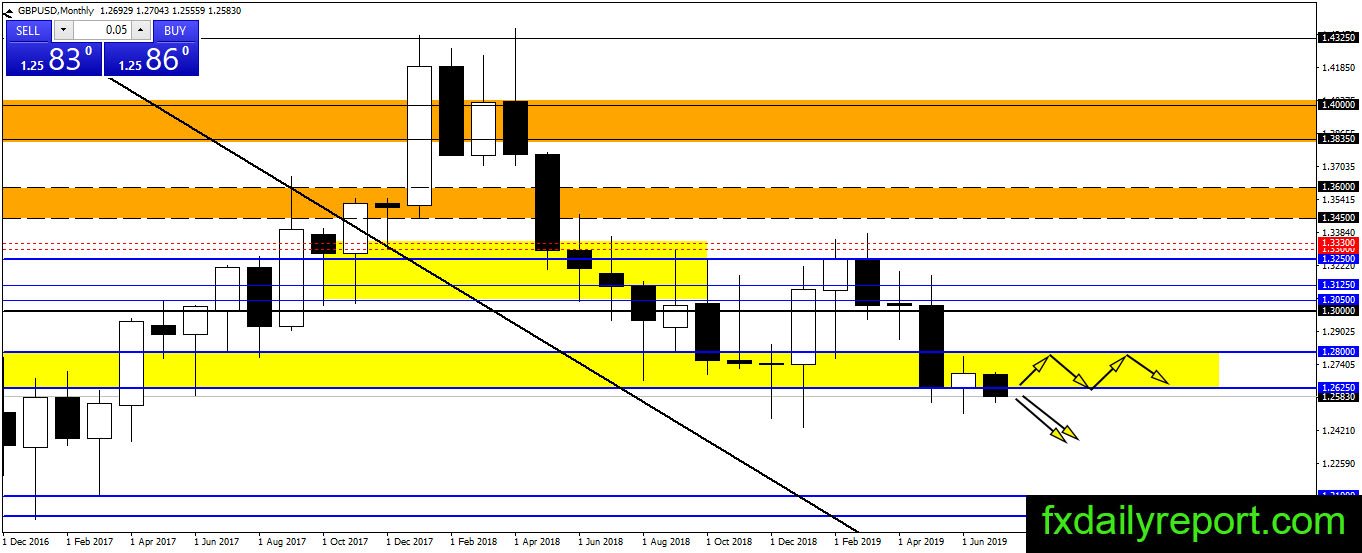
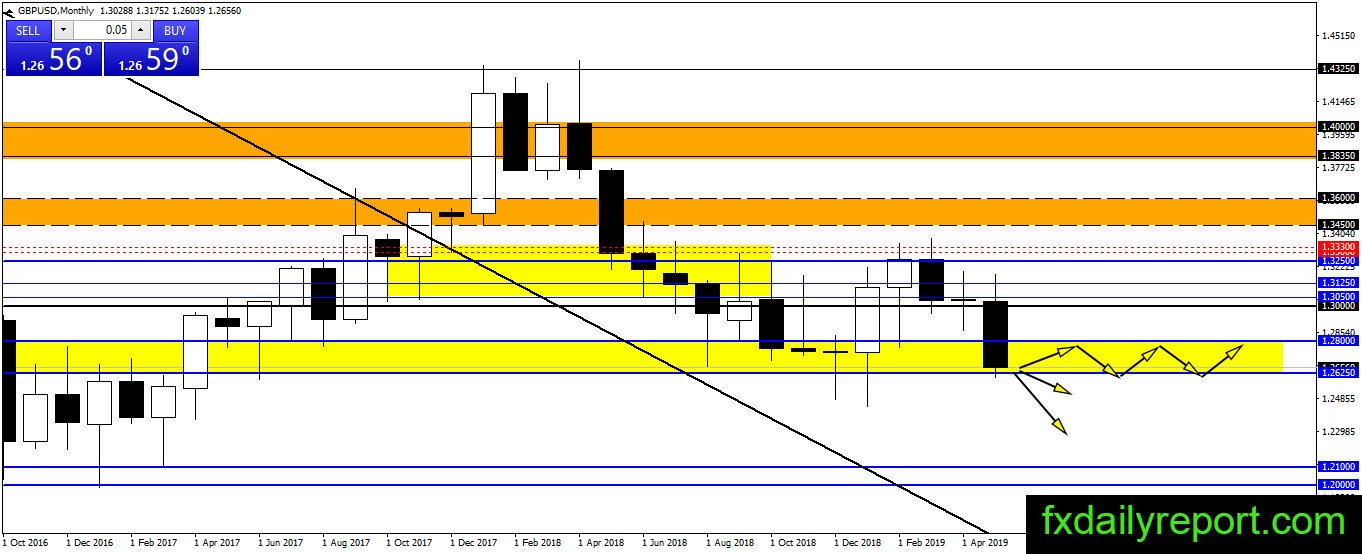
GBP/USD bear could not secure a close below 1.2625 on the monthly chart. In the previous month, we have a bounce from 1.2625 where the price moves up to a level near 1.2800 before turned lower. This month, GBP/USD kick-off the month with a movement below 1.2625. But, it seems the bearish pressure will recede and we might have another close above 1.2625. Traders will wait until the end of the month to determine if breakout or bounce will happen.
Weekly chart
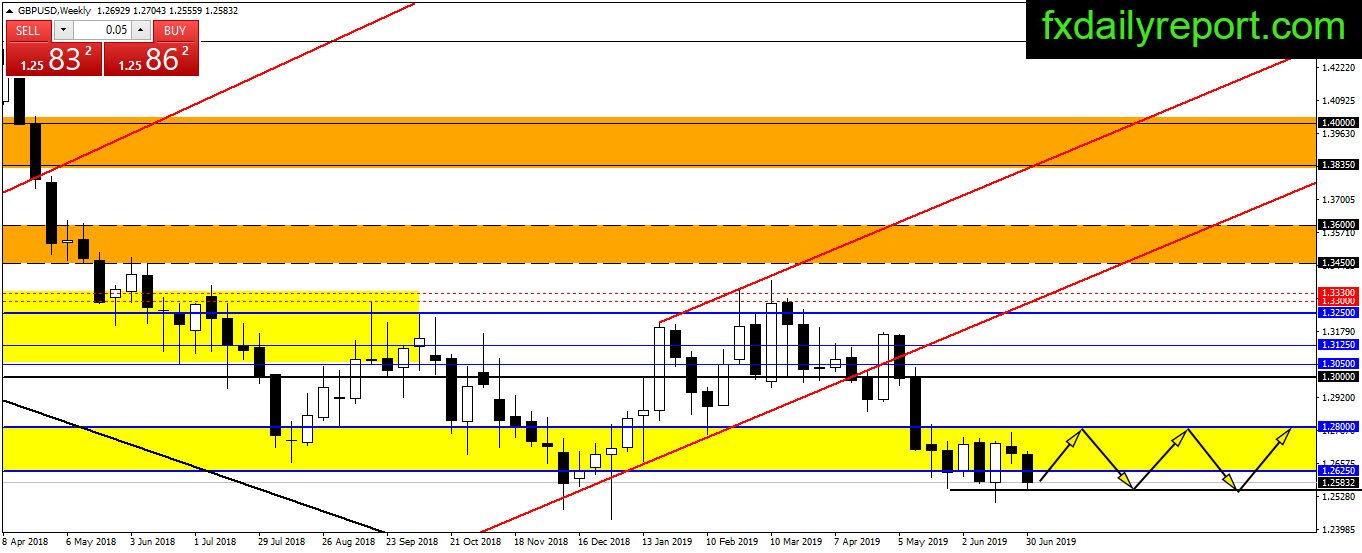
GBP/USD weakens on the weekly chart and fell below 1.2625. The pair looks will test the bottom support and decide the next direction. If a bounce happens then we could expect the pair to range inside 1.2550 – 1.2800.
Daily chart
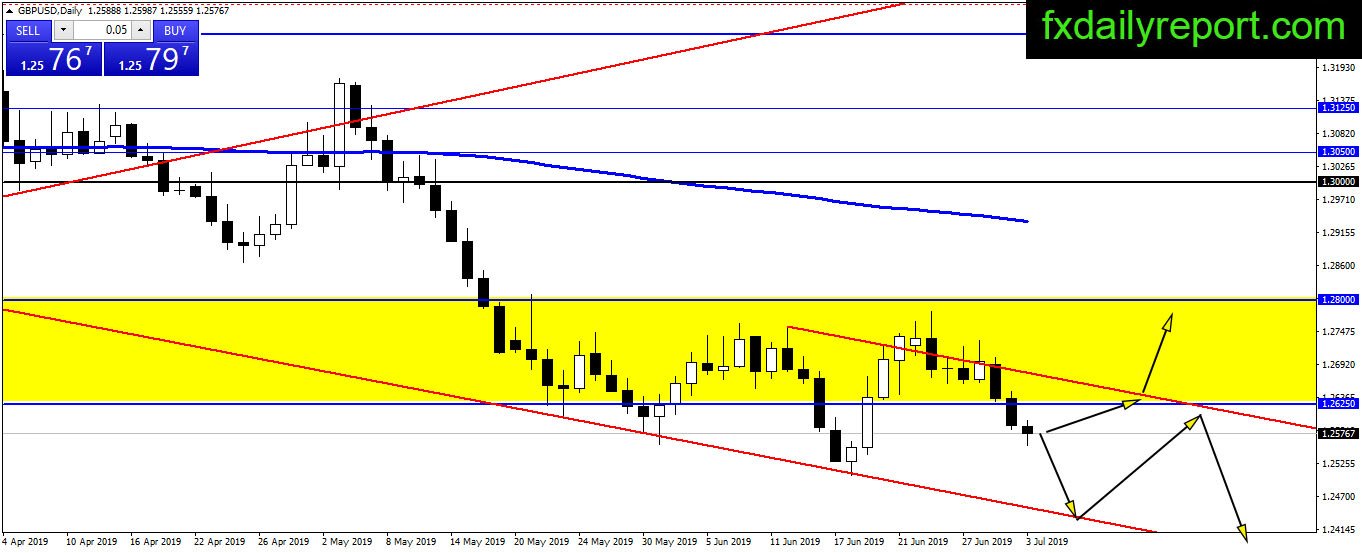
The bearish channel on the GBP/USD chart seems still valid after the pair rejected from the top of the channel. Currently, the bear is in control and push the price lower. Without any change to the trend then we could expect GBP/USD to reach the bottom of the channel.
Trade plan
No conclusive direction yet for long-term. GBP/USD currently stick near 1.2625 and looking to defend the support level. A long position might be the best idea to take while the shift from the fundamental side happens in The Fed. However, the long-term Brexit issue has not solved yet and should have an impact on GBP/USD long-term trend.