
On Thursday, the GBP/USD currency pair pulled back from the session high of about 1.2770 to trade at about 1.2752. The currency pair trades within an ascending channel formation in the 60-minute chart.
The pair has now advanced to trade a few levels above the 100-hour moving average line. As a result, the currency pair is on the verge of entering the overbought levels of the 14-hour RSI.
GBP/USD Fundamentals Overview

From a fundamental perspective, the GBP/USD currency pair trades during a relatively busy period in the U.S. market. On Thursday, the U.S. initial jobless claims for the week ending November 29 missed the expected claim count of 215k with a tally of 224k, up from 215k. Challenger job cuts for November also increased slightly from 55.59k to 57.72k.
On Wednesday, the US ADP employment change for November fell short of the forecasted change of 150k with a tally of 146k, down from 184k in October. The ISM Services PMI for November also fell short of the forecasted reading of 55.5 with a reading of 52.1, while the S&P Global Composite PMI missed the estimate of 55.3 with a reading of 54.9.
Elsewhere, the JOLTS job openings for October exceeded the expectation of 7.48 million with a tally of 7.744 million. The ISM Manufacturing PMI for November beat the forecast of 47.5 with a reading of 48.4, while the ISM Manufacturing Prices Paid missed 55.2 with a reading of 50.3. In the UK, the BRC Like-For-Like sales for November fell short of the forecasted (YoY) change of 0.7% with a change of -3.4%.
GBP/USD Technical Analysis (the 60-min Chart)
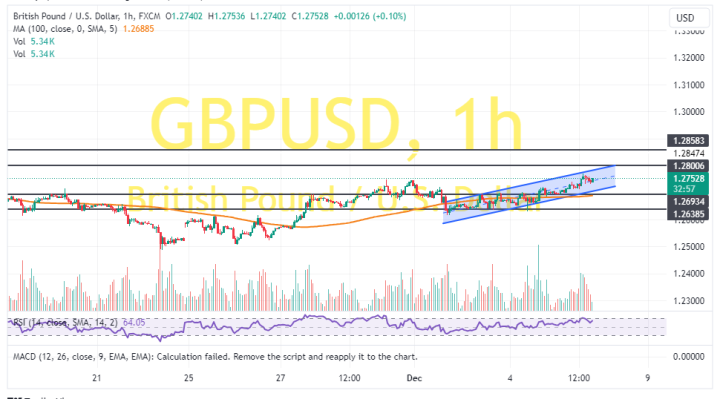
Technically, the GBP/USD currency pair trades within an ascending channel formation in the 60-minute chart. Thursday’s late pullback prevented the 14-hour RSI from entering the overbought conditions.
Therefore, the bears will look to stretch the pullback towards 1.2693 or lower to 1.2638. On the other hand, the bulls will look to extend the current rally towards 1.2800 or higher to 1.2858.
GBP/USD Technical Analysis (the Daily Chart)
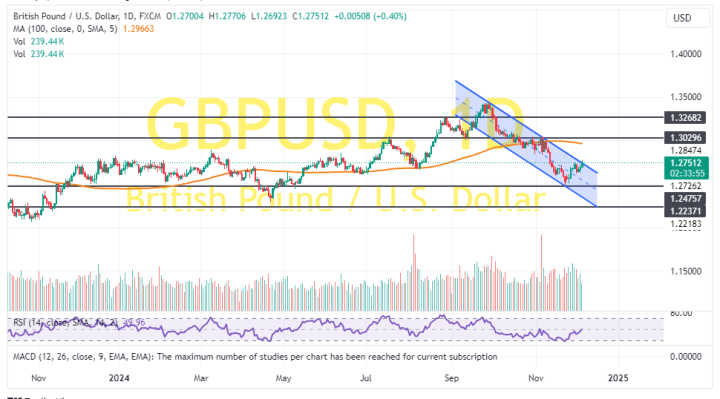
In the daily chart, the GBP/USD currency pair trades within a descending channel formation. However, the 14-day RSI has recently bounced back to avoid falling into the oversold conditions.
Therefore, the bulls will look to extend the current rebound towards 1.3029 or higher to 1.3268. On the other hand, the bears will look to ride the current decline to 1.2475 or lower to 1.2237.