
The GBP/USD currency pair on Friday extended the current 2-day pullback towards 1.3030 following the latest round of the UK and US data. The currency pair continues to trade within a slightly ascending channel in the 60-min chart.
The latest pullback pushed it close to the 100-hour SMA while the 200-hour SMA is a few levels below. The currency pair also appears to be closer to crossing over to oversold levels of the 14-hour RSI. This could trigger a temporary rebound.
GBP/USD Fundamentals Overview

From a fundamental perspective, the GBP/USD currency pair is trading at the back of a relatively active period in both the UK and the US markets. In the UK, the preliminary Markit Services PMI for October missed the expectation of 54 with 52.3. Earlier in the day on Friday, retail sales for September beat the (YoY) and (MoM) expectations of 3.7% and 0.4%, respectively with 4.7% and 1.5%. Retail sales ex-fuel also outperformed expectations with (YoY) and (MoM) changes of 6.4% and 1.6% versus 5% and 0.5%.
In the US, the preliminary Markit Manufacturing PMI for October missed the expectation of 53.4 with 53.3. On the other hand, the Services PMI beat the expectation of 54.6 with 56 while the PMI Composite improved to 55.5 up from 54.3 in the previous period. Earlier in the week, the US initial jobless claims for the week ending Oct. 17 beat the expectations of 840k claims with 787k while continuing claims for the preceding week impressed with 8.373M versus an expectation of 9.5M.
GBP/USD Technical Analysis (the 60-min Chart)
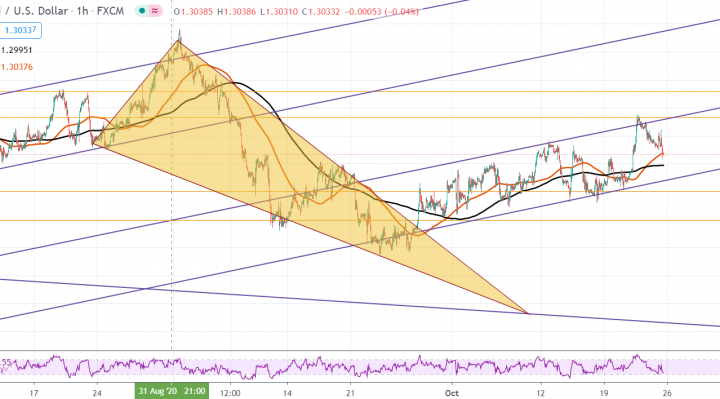
Technically, the GBP/USD currency pair appears to be trading within a gently ascending channel in the 60-mn chart. This indicates a slight short-term bullish bias in the market sentiment. The pair has recently pulled back to move closer to oversold levels of the 14-hour RSI.
The bulls will be targeting short-term rebound profits at around 1.3166 or higher at 1.3258. On the other hand, the bears will look to extend the current pullback towards 1.2902 or lower at 1.2796.
GBP/USD Technical Analysis (the Daily Chart)
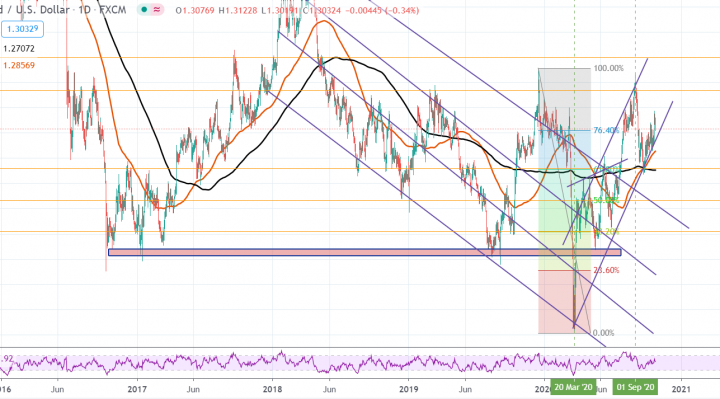
In the daily chart, the GBP/USD currency pair appears to be trading within a sharply ascending channel. This indicates a strong long-term bullish bias in the market sentiment. The pair has now moved closer to overbought levels of the 14-day RSI.
The bulls will be looking to stretch the current gains towards 1.3341 or higher at 1.3599. On the other hand, the bears will target long-term pullback profits at around 61.80% and 50% fib levels at 1.2718 and 1.2463, respectively.