
The GBP/USD currency pair on Friday extended the current 2-day pullback towards 1.3300 despite a quiet US session. The currency pair retains a short-term bullish outlook in an ascending channel.
The pair is now pinned to the 200-hour SMA while the 100-hour SMA is a few levels higher. The extended declines pushed the currency pair closer to oversold levels of the 14-hour RSI in the 60-min chart.
GBP/USD Fundamentals Overview

From a fundamental perspective, the GBP/USD currency pair is trading at the back of a relatively quiet period in the UK market. There was little to note from the Western European nation apart from the havoc caused by the coronavirus pandemic. On Monday, the preliminary UK Markit manufacturing PMI for November beat the expectation of 50.5 with 55.2. The services PMI also outperformed 41.5 with 45.8.
In the US, the durable goods orders for October beat the expectation of 0.9% with 1.3% while nondefense capital goods orders ex-aircraft outperformed 0.5% with 0.7%. Durable goods orders ex-transportation grew 1.3% to beat the expected growth of 0.4% while the preliminary core personal consumption expenditure for Q3 matched the expectation of 3.5%.
Earlier in the week, the preliminary US Markit manufacturing PMI for November beat 53 with 56.7 while the services PMI outperformed 55.3 with 57.7. The housing price index for September beat the (MoM) expectation of 1.1% with 1.7%.
GBP/USD Technical Analysis (the 60-min Chart)
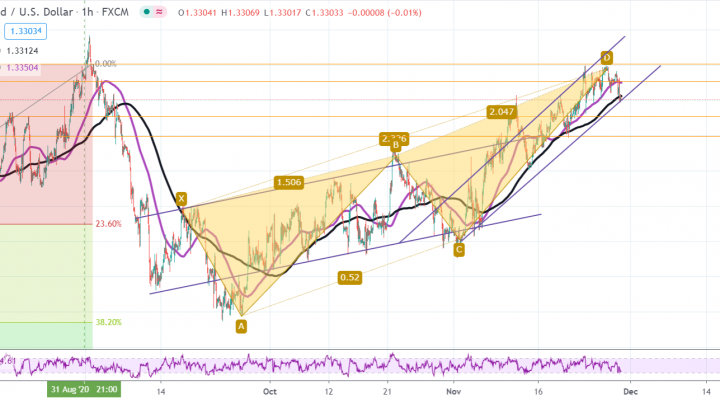
Technically, the GBP/USD currency pair appears to be trading within a gently ascending channel in the 60-min chart. This indicates a significant short-tern bullish bias in the market sentiment. The pair has recently pulled back to move close to oversold levels of the 14-hour RSI.
The bulls will be targeting short-term rebound profits at around 1.3352 or higher at 1.3403. On the other hand, the bears will look to extend the current pullback towards 1.3254 or lower at 1.3198.
GBP/USD Technical Analysis (the Daily Chart)
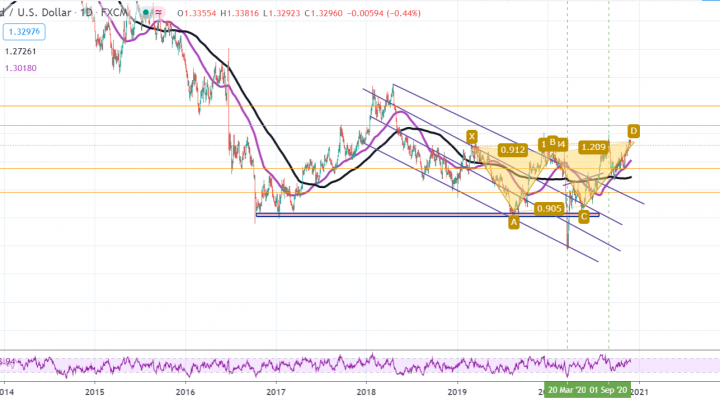
In the daily chart, the GBP/USD currency pair appears to be trading within a rising pattern formation. The pair recently completed the XABCD double-bottom reversal pattern. This set it on a recovery bull-run.
The bulls will be looking to extend this run towards 1.3643 or higher at 1.3987. On the other hand, the bears will look to pounce for long-term profits at around 1.2875 or lower at 1.2458.