
The GBP/USD currency pair on Friday pulled back off the current 3-year highs of about 1.3748 to trade at 1.3690 after UK employment data. The currency pair appears to be trading within a relatively choppy ascending wedge formation in the 60-min chart.
The pair is now trading just off the 100-hour SMA while the 200-hour SMA is a few levels below. Friday’s pullback pushed the currency pair closer to oversold levels of the 14-hour RSI. This could trigger a short-term rebound.
GBP/USD Fundamentals Overview

From a fundamental perspective, the GBP/USD currency pair is trading at the back of a relatively busy period in both the UK and the US markets. On Thursday, the UK claimant count change for December beat the expectation of 35k with a count of 7k. The 3-month ILO unemployment rate through November also came in better than expected with 5% versus 5.1%. On the other hand, average earnings including bonuses beat the (YoY) expectation of 2.9% with a growth of 3.6% over the 3-month period. The equivalent excluding bonuses also outperformed with a (YoY) growth of 3.6% versus 3.2%.
In the US, personal spending for December beat the expectation of -0.4% with a change of -0.2%. Personal income for the period also outperformed 0.1% with 0.6% (MoM). On the other hand, the core personal consumption price index for December beat the expectation of 0.1% with 0.3% (MoM). The (YoY) equivalent posted a change of 1.5% versus an expectation of 1.3%.
GBP/USD Technical Analysis (the 60-min Chart)

Technically, the GBP/USD currency pair appears to be trading within a gently ascending wedge formation in the 60-min chart. This indicates a significant short-term bullish bias in the market sentiment. The pair pulled back on Friday to avoid crossing to overbought levels of the 14-hour RSI.
The bulls will be targeting short-term rebound profits at around 1.3748 or higher at 1.3797. On the other hand, the bears will look to pounce for profits at around 1.3639 or lower at 1.3563.
GBP/USD Technical Analysis (the Daily Chart)
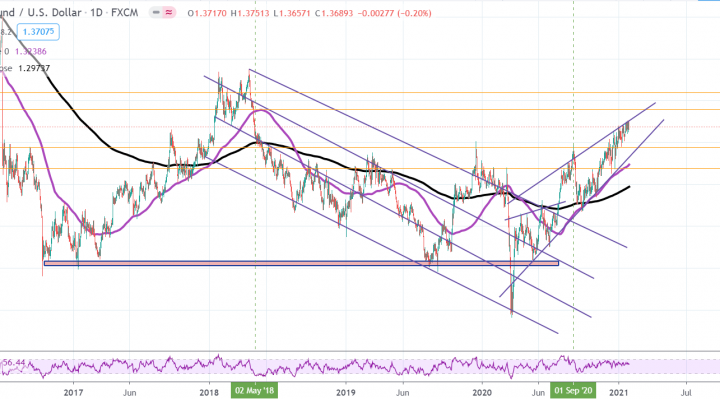
In the daily chart, the GBP/USD currency pair appears to be trading within a sharply rising wedge formation. This indicates a strong long-term bullish bias in the market sentiment. The pair remains closer to the overbought levels of the 14-day RSI.
The bulls will be looking to ride the current bull-run by targeting profits at around 1.3898 or higher at 1.4099. On the other hand, the bears will target long-term pullbacks at around 1.3438 or lower at 1.3194.