
The GBP/USD currency pair on Tuesday pulled back off the current 4-week highs of about 1.2198 to trade at about 1.2155. The currency pair appears to be trading within a sideways channel formation in the 60-min chart.
The pair continues to trade several levels above the 100-hour moving average line. However, Tuesday’s pullback prevented the currency pair from ascending to the overbought levels of the 14-hour RSI.
GBP/USD Fundamentals Overview

From a fundamental perspective, the GBP/USD currency pair is trading at the back of a relatively busy period in both markets. On Tuesday, the UK Claimant Count Change for February missed the expectation of -12.4k with -11.2k. On the other hand, the ILO unemployment rate for the month outshone the forecasted rate of 3.8% with a rate of 3.7%, while average earnings excluding bonuses for the 3-month period ending January 31 missed the expected growth of 6.6% with a growth rate of 6.5%. The claimant count rate for February remained unchanged from January at 3.8%.
In the US, the consumer price index for February fell slightly to 6% (YoY), down from 6.4% in January, in line with expectations. The (MoM) equivalent also declined to 0.4% down from 0.5%, matching expectations. Elsewhere, the consumer price index ex-food and energy matched the expected (YoY) change of 5.5%, down from 5.6% in January, while the (MoM) equivalent beat the forecasted change of 0.4% with a change of 0.5%, up from 0.4% in the previous month.
GBP/USD Technical Analysis (the 60-min Chart)
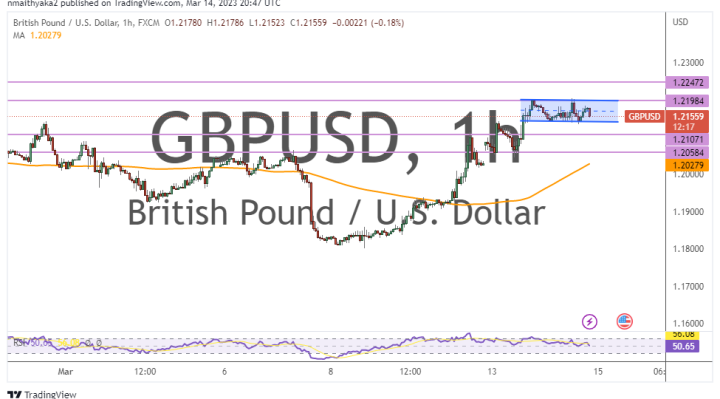
Technically, the GBP/USD currency pair appears to be trading within a sideways channel formation in the 60-min chart. This indicates a lack of a clear directional bias in the market sentiment.
Therefore, the bulls will be targeting short-term rebound profits at about 1.2198 or higher at 1.2247. On the other hand, the bears will look to pounce on profits at about 1.2107 or lower at 1.2058.
GBP/USD Technical Analysis (the Daily Chart)
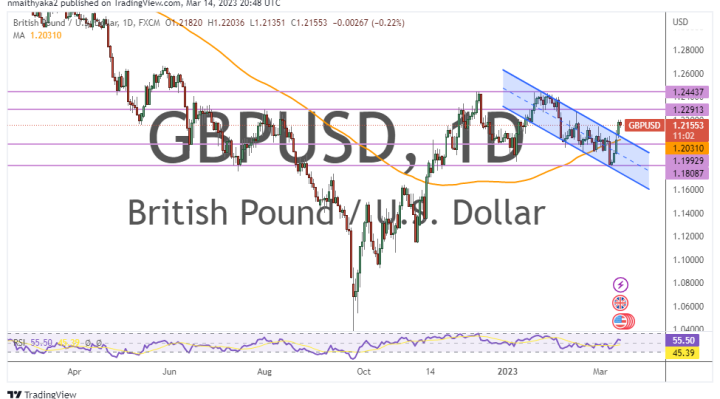
In the daily chart, the GBP/USD currency pair appears to be trading within a descending channel formation. This indicates a significant long-term bearish bias in the market sentiment.
Therefore, the bears will be looking to stretch the current run of declines toward 1.1992 or lower to 1.1808. On the other hand, the bulls will be targeting long-term profits at about 1.2291 or higher at 1.2443.