
The GBP/USD currency pair on Friday pulled back off the current monthly highs of about 1.3890 to trade at about 1.3855 after the latest UK data. The currency pair continues to trade within a gently ascending channel formation in the 60-min chart.
The pair also crossed above the 100-hour moving average earlier in the week, pushing it to overbought conditions of the 14-hour RSI. However, Friday’s pullback pushed it back to the normal trading zone of the strength indicators.
GBP/USD Fundamentals Overview

From a fundamental perspective, the GBP/USD currency pair is trading at the back of a relatively busy period in both markets. On Friday, the UK industrial production for July beat the expected (YoY) change of 3% with 3.8%. In addition, industrial production for the months outperformed the (MoM) estimate of 0.4% with a change of 1.2%. However, manufacturing production missed 0.1% with 0.0% (MoM), while the GDP for the period also came short of 0.6% with 0.1%. Elsewhere, the index of services for the 3-month period ended July missed the expected 3-month change of 5.3% with 4.5%.
In the US, the general producer price index and ex-food and energy beat expectations on both (MoM) and (YoY) basis. Earlier in the week, the initial jobless claims for the week ending September 3rd beat the expected claim count of 335k with a lower tally of 310k. On the other hand, continuing claims for the period ending Aug 27th missed the expected tally of 2.744 million with a claim higher count of 2.783 million.
GBP/USD Technical Analysis (the 60-min Chart)
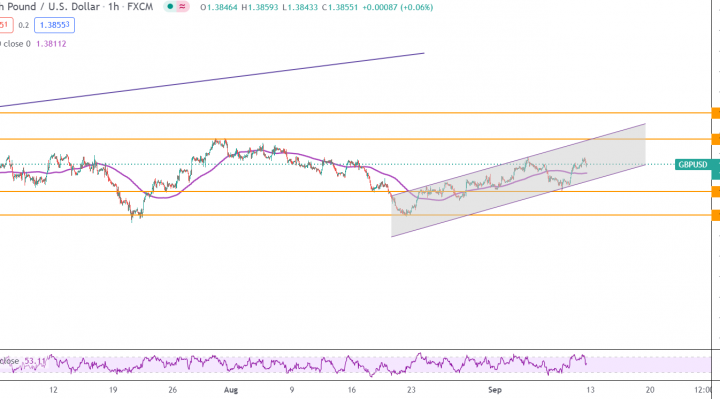
Technically, the GBP/USD currency pair appears to be trading within a gently ascending channel formation in the 60-min chart. However, the currency pair gas recently pulled back to return to the normal trading zone after crossing to overbought conditions earlier in the week.
Therefore, the bulls will be targeting short-term rebound profits at approximately 1.3974 or higher at 1.4104. On the other hand, the bears will look to pounce for profits at around 1.3721 or lower at 1.3607.
GBP/USD Technical Analysis (the Daily Chart)
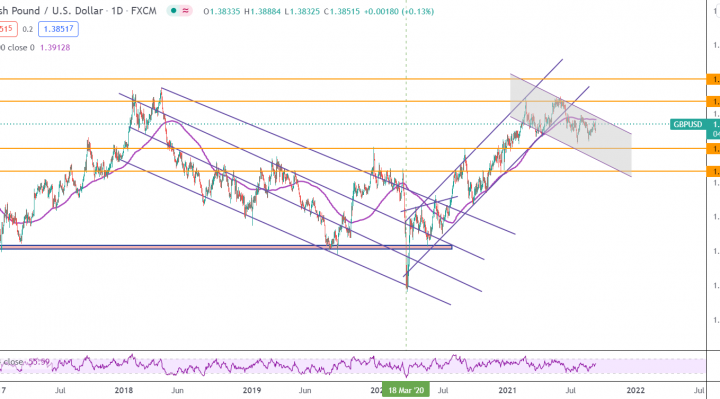
In the daily chart, the GBP/USD currency pair appears to be trading within a descending channel formation. However, the currency pair has recently bounced back to rally towards the 100-day moving average.
Therefore, the bulls will be looking to extend the current rebounds towards 1.4181 or higher to 1.4508. On the other hand, the bears will target potential long-term pullbacks at 1.3491 or lower at 1.3162.