
The GBP/USD currency pair on Friday pulled back off the day’s session highs of about 1.2106 to trade at about 1.2040. The currency pair appears to be trading within a descending channel formation in the 60-min chart.
Friday’s late pullback pushed the currency pair below the 100-hour moving average line. As a result, the currency pair now appears to be trading centrally in the 14-hour RSI with more room left for a shift on either side.
GBP/USD Fundamentals Overview

From a fundamental perspective, the GBP/USD currency pair is trading at the back of a relatively busy period in the US market. On Friday, the Chicago Purchasing Manager’s Index for December outperformed the expected reading of 41.2 with a reading of 44.9. On Thursday, the initial jobless claims for the week ending December 23 increased to 225k, up from 216k in the previous week. Continuing claims for the period also edged slightly higher to 1.71 million up from 1.669 million.
Earlier in the week, pending home sales for November missed the expected (MoM) change of 0.6% with a change of -4%, while the housing price index for October also fell short of 0.8% with a change of 0% (MoM). Elsewhere, the S&P/Case-Shiller Home Price Indices for October failed to match the expected (YoY) change of 9.7% with a change of 8.6%.
In the UK, the non-seasonally-adjusted Nationwide Housing Prices for December increased by 2.8% (YoY) compared to an increase of 4.4% reported in the previous period. The seasonally adjusted equivalent posted a change of -0.1% (MoM) compared to a forecast of -1.4%
GBP/USD Technical Analysis (the 60-min Chart)
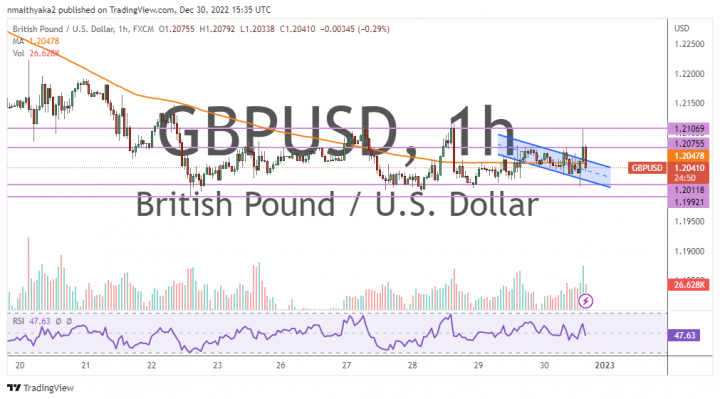
Technically, the GBP/USD currency pair appears to be trading within a descending channel formation in the 60-min chart. This indicates a significant short-term bearish bias in the market sentiment.
Therefore, the bears will be looking to extend the downward movement towards 1.2011 or lower to 1.1992. On the other hand, the bulls will look to pounce on profits at about 1.2075 or higher at 1.2106.
GBP/USD Technical Analysis (the Daily Chart)
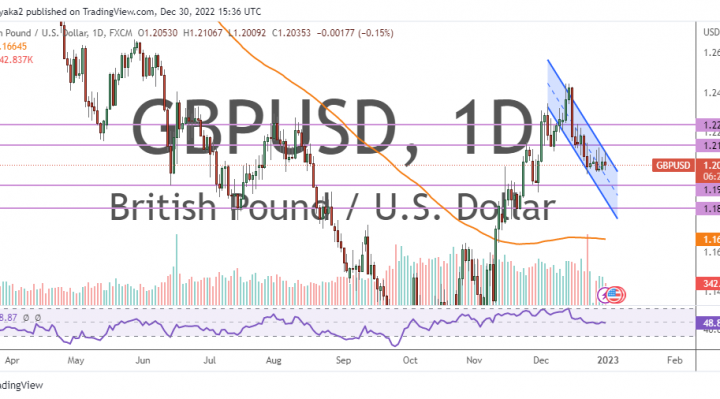
In the daily chart, the GBP/USD currency pair seems to be trading within a sharply descending channel formation. This indicates a strong long-term bearish bias in the market sentiment.
Therefore, the bears will be targeting long-term profits at about 1.1934 or lower at 1.1819. On the other hand, the bulls will look to pounce on profits at about 1.2136 or higher at 1.2239.