
On Thursday, the GBP/USD currency pair pulled back from the session highs of about 1.2529 to trade at about 1.2375. The currency pair also completed a downward breakout from a sideways channel formation in the 60-minute chart.
The pair has since descended to trade several levels below the 100-hour moving average line. As a result, the currency pair has plummeted into the oversold levels of the 14-hour RSI.
GBP/USD Fundamentals Overview

From a fundamental perspective, the GBP/USD currency pair trades during a relatively busy period in the U.S. market. On Thursday, the initial jobless claims for the week ending December 27 beat the forecasted claim count of 220k with a tally of 211k, down from the preceding week’s equivalent of 222k. The continuing claims for the preceding week also outshone the forecast of 1.89 million with a tally of 1.844 million, down from 1.896 million.
On the other hand, construction spending for November missed the expected (MoM) change of 0.3% with a change of 0%, while the S&P Global Manufacturing PMI for December beat 48.3 with a reading of 49.4.
Earlier in the week, the US housing price index for October missed the expected (MoM) change of 0.5% with a change of 0.4%. On the other hand, the S&P/Case-Shiller Home Price Indices for October outshone the forecast of 4.1% with a (YoY) change of 4.2%.
In the UK, the nationwide housing prices for December beat the (MoM) and (YoY) forecasts of 0.1% and 3.8%, respectively with changes of 0.7% and 4.7%. The S&P Global/CIPS Manufacturing PMI for December missed 47.3 with a reading of 47.
GBP/USD Technical Analysis (the 60-min Chart)
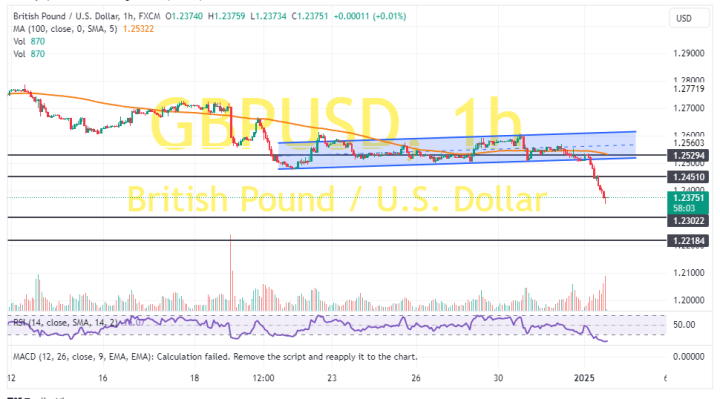
Technically, the GBP/USD currency pair has completed a downward breakout from a sideways channel formation. The 14-hour RSI also supports a downward bias after falling into oversold conditions.
Therefore, the bears will look to stretch the current pullback towards 1.2302 or lower to 1.2218. On the other hand, the bulls will look to pounce on rebounds at about 1.2451 or higher at 1.2579.
GBP/USD Technical Analysis (the Daily Chart)
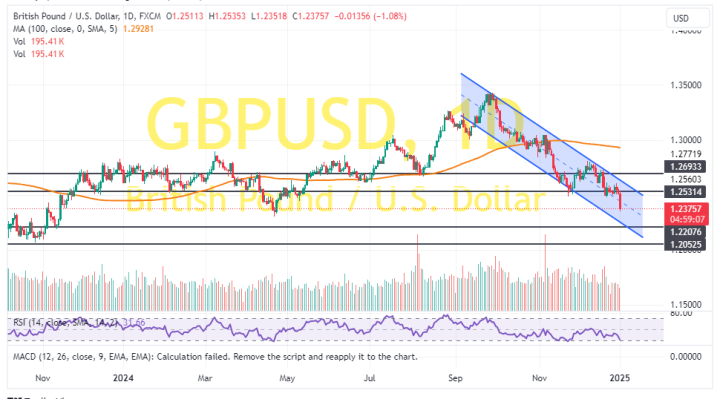
In the daily chart, the GBP/USD currency pair trades within a descending channel formation. The 14-day RSI has also pulled back to move closer to the oversold conditions of the indicator.
Therefore, the bears will be looking to ride the current run of declines toward 1.2207 or lower to 1.2052. On the other hand, the bulls will look to pounce on rebounds at about 1.2531 or higher at 1.2693.